WordPress White Screen Of Death: The Playbook, Step By Step.
A WordPress white screen of death gives you no error to read. See how the WP Doctor playbook diagnoses it in five steps, behind a snapshot.

A white screen is not an error message. It is the absence of one.
There is no stack trace, no plugin name and no hint. Just an empty page on a site that worked an hour ago.
That is why the usual advice starts with guessing: rename the plugins folder, switch the theme, raise the memory limit, and see what happens.
Short answer: a WordPress white screen of death is a symptom with several different causes, and the fix depends on which one you have. WP Doctor is a Protuno playbook that works in five fixed steps: probe how it can reach the site, record a health baseline, match the evidence to a known failure signature, apply one fix behind a snapshot, then re-run the exact check that failed. If it cannot match a signature or safely reach the cause, it hands off instead of guessing.
What this post is, and is not: it is a practical walk through how a diagnosis playbook is built, based on the WP Doctor playbook as it appears in the Protuno dashboard. It is not a claim that every white screen is fixable automatically, and it does not quote results from a run. Where a cause sits outside WordPress, the honest answer is a hand-off to a human.
An empty page is a fact about the output. A signature is a fact about the cause.
Why Deactivate Everything Falls Short
The folk fix is to deactivate every plugin, then reactivate them one at a time. It works often enough that people trust it. It also hides three problems.
First, it is a fix without a diagnosis. If the page comes back, you know a plugin was involved. You do not know the fault, or whether a stuck update was the real cause.
Second, it assumes the cause lives in WordPress. A blank page can also come from the server or a CDN, and plugin shuffling touches neither.
Third, there is no definition of “fixed”. If the homepage loads, the job feels done. But a homepage that returns 200 while the admin or the REST API is still failing is not a healthy site. This is the same trap described in WordPress rollback after an update: a homepage-only check misses the failures that sit below it.
A good diagnosis fixes the order. Measure first. Match to a known cause. Change one thing. Check again.
Three Ways To Look At A Blank Page
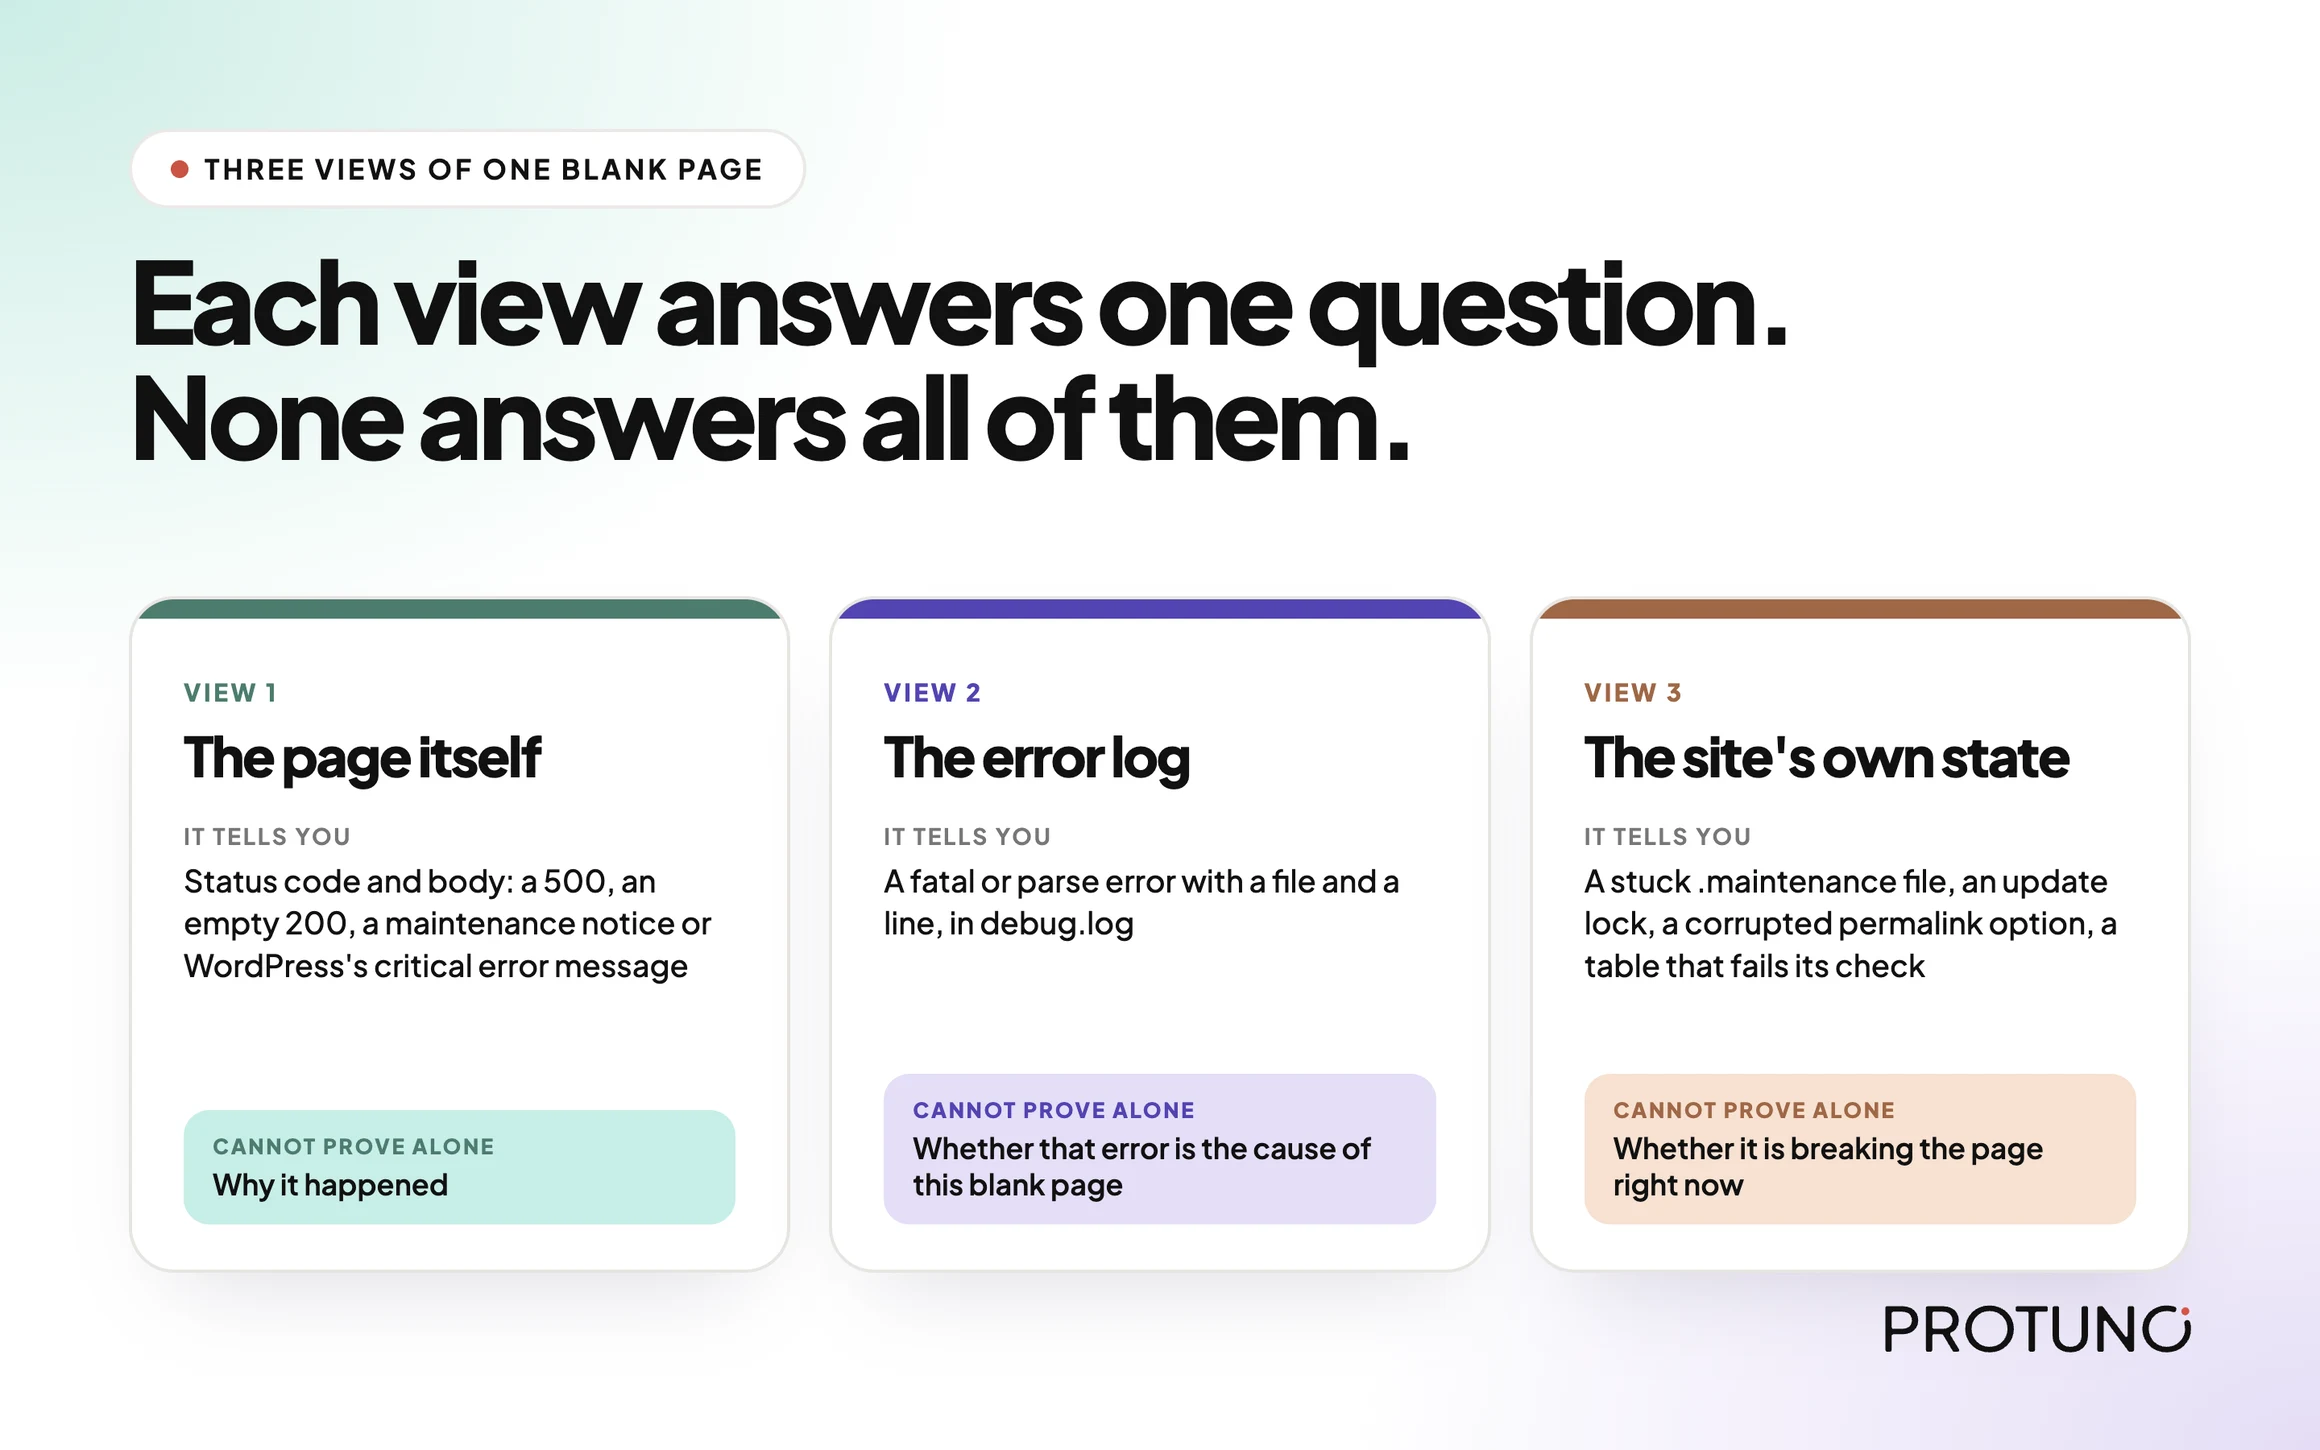
When a site goes white you can approach it from three directions. None is enough alone.
| View | What it tells you | What it cannot prove alone |
|---|---|---|
| The page itself (status code and body) | Whether the response is a 500, an empty 200, a maintenance notice or WordPress’s own critical error message | Why it happened |
The error log (debug.log) | A fatal or parse error, with a file and a line | Whether that error is the cause of this blank page or an old one |
| The site’s own state (files, options, tables) | A stuck .maintenance file, an update lock, a corrupted permalink option, a table that fails its check | Whether it is currently breaking the page |
A white screen with a fatal in the log and a 500 is a different problem from an empty 200 with a clean log. You want all three views before you touch anything.
The Playbook, Step By Step
WP Doctor is a Protuno maintenance playbook, shown in the dashboard with a Beta label, five steps, and a “can write” status. It is a general-purpose WordPress diagnosis playbook, so a white screen is one of the problems it is built to handle. It is not on the public playbooks page yet, so treat it as a new playbook that is still being rolled out.
It runs a fixed sequence. Steps 1 to 3 only read the site. Step 4 is the only one that can change anything, and only behind a backup. Step 5 re-checks and reports.
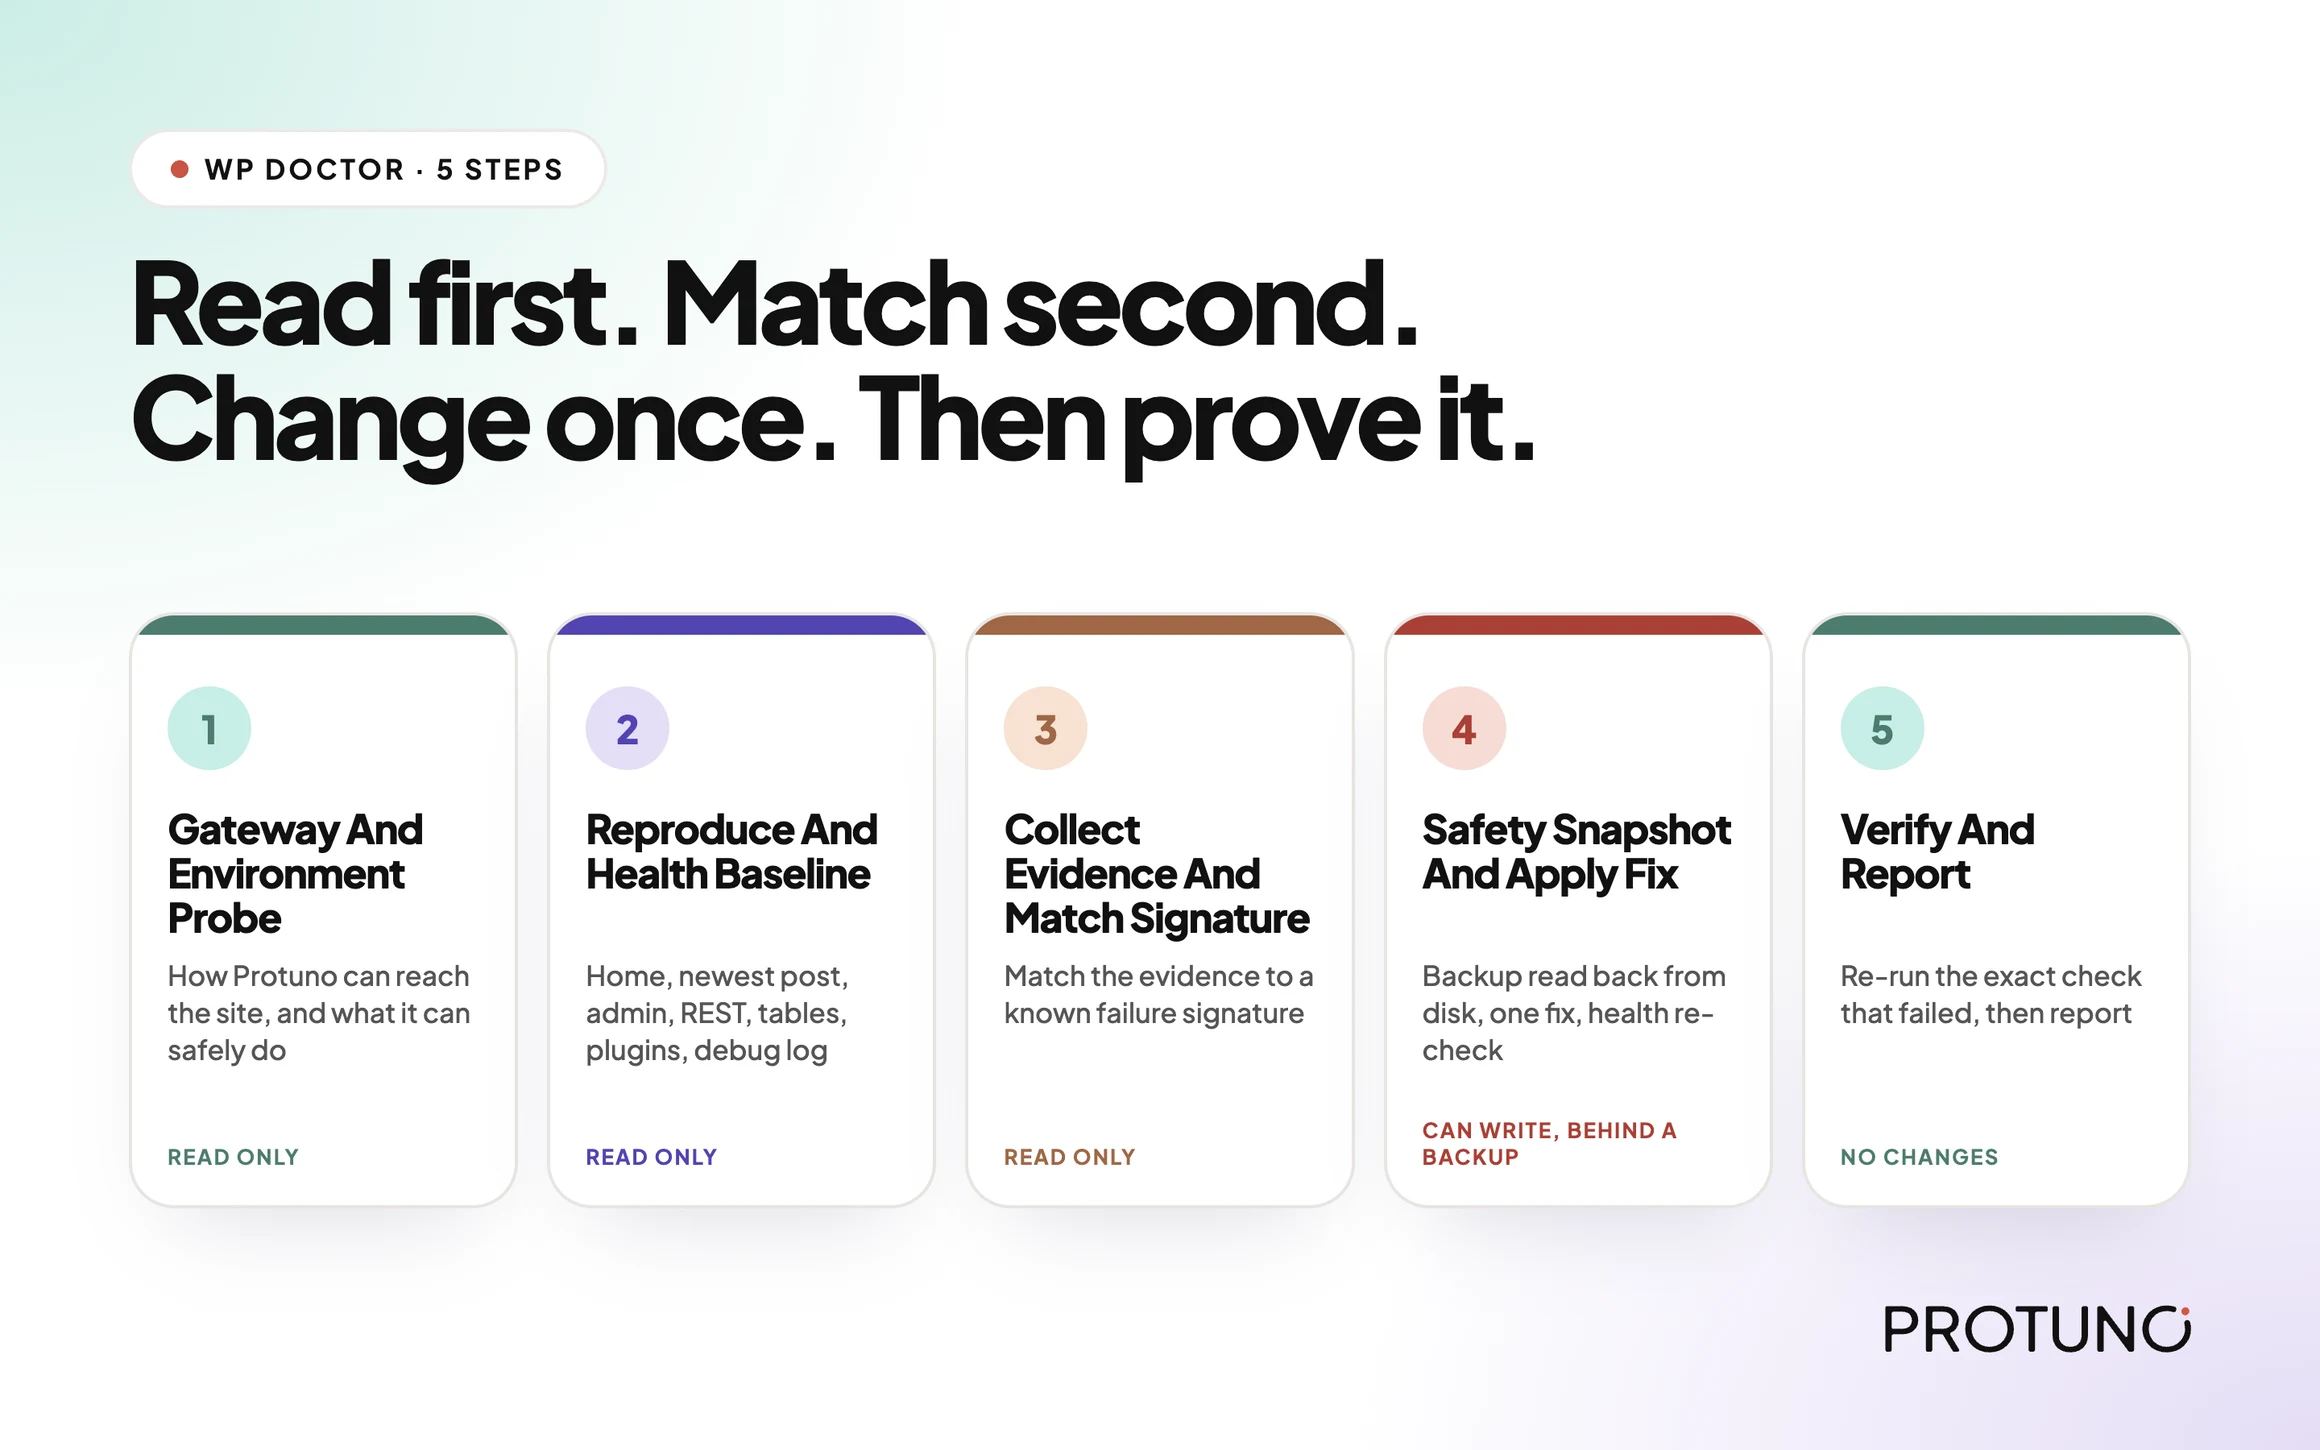
| # | Step | What it does |
|---|---|---|
| 1 | Gateway And Environment Probe | Works out how Protuno can reach the site and what it can safely do. Records WordPress and PHP versions, the real table prefix, multisite status, server software and the site URLs. Read only. |
| 2 | Reproduce And Health Baseline | Probes the homepage, the newest published post, wp-admin and the REST API. Checks the database tables, key options and files, active plugins and theme, and the recent tail of debug.log. Defines what “healthy” means for this site. Read only. |
| 3 | Collect Evidence And Match Signature | Bundles the evidence and matches it against a catalogue of known failure signatures. Localizes the layer and decides: auto-fix, propose, hand off or escalate. Read only. |
| 4 | Safety Snapshot And Apply Fix | Confirms a backup exists on disk, applies the one fix the diagnosis named, re-checks health, and rolls back automatically if the site got worse. Or applies nothing and hands off. |
| 5 | Verify And Report | Re-runs the exact check that failed, then writes a report with a status: fixed, rolled back, handed off, escalated or healthy. Makes no changes. |
The order is the point. The baseline exists before any change, so “did we break something” has an answer. The match exists before the fix, so evidence picks the fix.
Step 1: Know What You Can Reach
Before it looks at the white screen, the playbook records how it can reach the site. In the step instructions, access is the Protuno connection running PHP on the site: it can run PHP, query the database, read debug.log and read and write files.
It cannot run WP-CLI, has no SSH and has no CDN or edge API. Server and edge causes are detect-and-hand-off only. A tool that pretends it can reach everything will eventually “fix” something it cannot see.
Step 2: Write Down Healthy Before Changing Anything
The baseline probes the homepage, the permalink of the newest published post, the admin and the REST API, each with a timeout. It then runs a table check on the database, reads the siteurl, home, permalink structure and any core updater lock, and checks whether a .maintenance file and an .htaccess file exist. It lists the active plugins and the active theme, and reads roughly the last 200 lines of the debug log.
Then it defines its health check. A site passes when the homepage returns 200, the newest post returns 200 (or there are no posts), wp-admin is reachable rather than erroring, the REST API returns 200, and no new PHP fatal or parse error has been added to the log since the baseline.
That definition is the tripwire for every later step. If step 4 changes something and health gets worse than the baseline, the change is reversed.
Step 3: Match A Signature, Or Say You Cannot
This is the step that replaces guessing. The instructions carry a catalogue of known failure signatures, and the playbook matches the evidence to it deterministically. Each signature is a set of signals that must all be true, optional signals that raise confidence, and signals that disqualify the match.
A few of the WordPress-layer signatures in the catalogue, in plain terms:
- A stuck maintenance state: a
.maintenancefile exists, or the homepage shows the “Briefly unavailable for scheduled maintenance” message. - A stuck update lock: the core updater lock option is set and there is no maintenance file.
- A permalink 404: the homepage returns 200, the post returns 404, and a permalink structure is set.
- A plugin fatal: a PHP fatal or parse error in the log, together with a 500, an empty homepage body or the “critical error” message.
- A theme conflict: errors in the log that point into the themes folder, with a 500.
- Others cover a REST API failure,
headers already sent, a 403, a login redirect loop and corrupted database tables.
Server and edge signatures are in the catalogue too, such as a database connection error or a Cloudflare 521 to 524. A 521 to 524 means the origin is down, so the playbook places the cause at the server and hands off.
Two rules keep it honest. If nothing matches, it escalates and no fix is invented. If two high-confidence matches point at different causes, it escalates rather than picking one.
The decision that comes out is one of four: auto-fix, propose, hand off or escalate.
Step 4: One Fix, Behind A Snapshot
Only now can anything change. The hard gate comes first: the options and files about to be touched are exported and copied, then the playbook reads the backup back from disk to confirm it exists and is not empty. If it is missing or empty, it refuses to apply the change.
Then it applies one logical fix. That can be more than one PHP call when the calls belong together, such as writing a corrupted permalink option back and then flushing the rewrite rules.
After the change it re-runs the health check against the baseline. If the site is worse, it restores from the backup, runs the check again to confirm it is back at baseline, and records that it rolled back.
For a plugin conflict, the fix is a bisect: deactivate the plugins, check health, then reactivate them one by one while checking between each, until the plugin that flips the site from passing to failing is found. It leaves that one deactivated and restores the rest. Every plugin that was active in the baseline and is not the culprit must end active. The site is never left stripped.
Some things are never applied: changing the site URL on an unconfirmed canonical, repairing InnoDB tables, setting the memory limit blind or touching database credentials. Those go to hand-off with exact steps for a human.
Step 5: Prove It, Or Do Not Claim It
The last step re-runs the exact check named in the diagnosis, such as the post URL that returned 404 or the REST endpoint that should answer. Never a softer one. It then picks one honest status: fixed, rolled back, handed off, escalated or healthy. The report names the layer and signature, the evidence that matched, what was applied and anything left for a human. “Fixed” is only allowed when the re-run passes.
A Small Test You Can Run Today
You do not need a playbook to see how a blank page behaves. Record four things before you change a setting:
- The status code and the length of the body for the homepage, a recent post, the admin and the REST API.
- Whether a
.maintenancefile exists in the WordPress root. - The last few lines of
wp-content/debug.log, if logging is enabled. - The active plugin list and the active theme, written down.
A rough version from a terminal:
# status code and size for each URL
for u in https://example.com/ https://example.com/a-recent-post/
         https://example.com/wp-admin/ https://example.com/wp-json/; do
  curl -s -o /dev/null -w "%{http_code} %{size_download} $un" "$u"
done

# a stuck maintenance state and the recent log
ls -la .maintenance
tail -n 50 wp-content/debug.log
Keep that output as your baseline. If the debug log is publicly readable, fix that first; this post on exposed debug logs explains why it matters.
Which Cause Are You Actually Looking At?
Different symptoms point at different layers. This is a rough map based on the signatures above, not a promise that a symptom always means one cause.
| If you see | A likely signature | Next action |
|---|---|---|
| “Briefly unavailable for scheduled maintenance” | Stuck maintenance state | Check for the .maintenance file after an interrupted update |
| Homepage 200 but posts 404 | Permalink problem | Check the permalink structure and flush the rewrite rules |
| 500 plus a fatal error in the log | Plugin fatal | Bisect the plugins with a restore point in place |
| “There has been a critical error” with a clean log | Critical error, medium confidence | Find the failing component by bisecting, since the log does not name it |
| Cloudflare 521 to 524 | Origin down | Treat it as a server problem and hand off |
| “Allowed memory size exhausted” in the log | Memory exhausted | Hand off, since the real limit is set by the host |
What WP Doctor Does Not Solve
A diagnosis playbook has edges. Being clear about them is part of the design.
- Server and edge causes. There is no SSH and no edge API in the reach. These are diagnosed and handed off, with exact steps for a human.
- Failures with no known signature. The decision is to escalate, with the evidence it found. It does not invent a fix.
- Hacked sites. Malware and SEO spam indicators are routed to malware removal. They are not repaired here.
- A site with no usable baseline. No baseline means no rollback tripwire, so it changes nothing.
Questions To Ask Your Current Tooling
Whatever repairs your broken sites, ask it:
- How does it define “fixed”, and is that check the one that failed?
- What happens when its fix makes things worse?
- Does it say so when the cause is outside WordPress, or does it try anyway?
If the answers are vague, you are being offered a button, not a process.
Fixing In The Right Order
When a fix is possible, order matters more than speed. Two practical rules apply to every case. Take a restore point before the first change, and confirm it can be read back. A backup you have not verified is a file with a hopeful name. Then re-run the check that failed after the change, not a friendlier one.
If an update caused it, the update process, written out before it runs is the way to have fewer of these.
A Five-Site Triage You Can Do This Week
Pick five sites and note, for each:
- The site and how it is hosted.
- Whether
debug.logis available to read, and whether it is public. - Whether a recent restore point exists and has been verified.
- Whether a homepage-only monitor is your only alert.
- Who gets the call if it goes white at 2 a.m.
Then decide for each gap: fix now, test first, replace, remove, accept with an owner and a date, or investigate. A homepage-only monitor notices a white screen and little else. Uptime monitoring that asserts content gives the diagnosis something to start from.
Why The Baseline Goes Stale
A baseline describes one moment. After an update, a theme change or a hosting move it is out of date, so record it again. WordPress security monitoring makes the same point about snapshots.
Where Protuno Fits
WP Doctor is one of the playbooks in the Protuno dashboard, and it is currently marked Beta. It can change a site, which is why the backup gate, the single fix and the automatic rollback sit in the middle of it. The playbooks that are public today are listed on the Protuno playbooks page.
The aim is not to remove the human. It is to make the first hour of a bad day a matter of evidence, and to say clearly when the next step is yours.
The Point
A white screen is a symptom, not a diagnosis.
The question is not “which plugin do I turn off”. It is “what did the site look like before it broke, and what is the evidence for the cause”.
Could you answer that for the next site that goes white?
Comments