WordPress Statistics For Operations: The State Of Things, September 2026.
57.6% of installs are on unsupported PHP by New Year’s Day. Plus what we found auditing our own portfolio, including the parts that failed.

Short answer: the headline wordpress statistics for operational health are worse than the ecosystem’s reputation suggests. 38.8% of installs run a PHP branch with no security fixes, and another 24.8% lose support on 31 December, taking the total to 57.6%.
This is the first of these I have written. Everything below was measured rather than cited from somebody else’s report, and the second half is our own portfolio, including the parts that failed.
The ecosystem-wide WordPress statistics
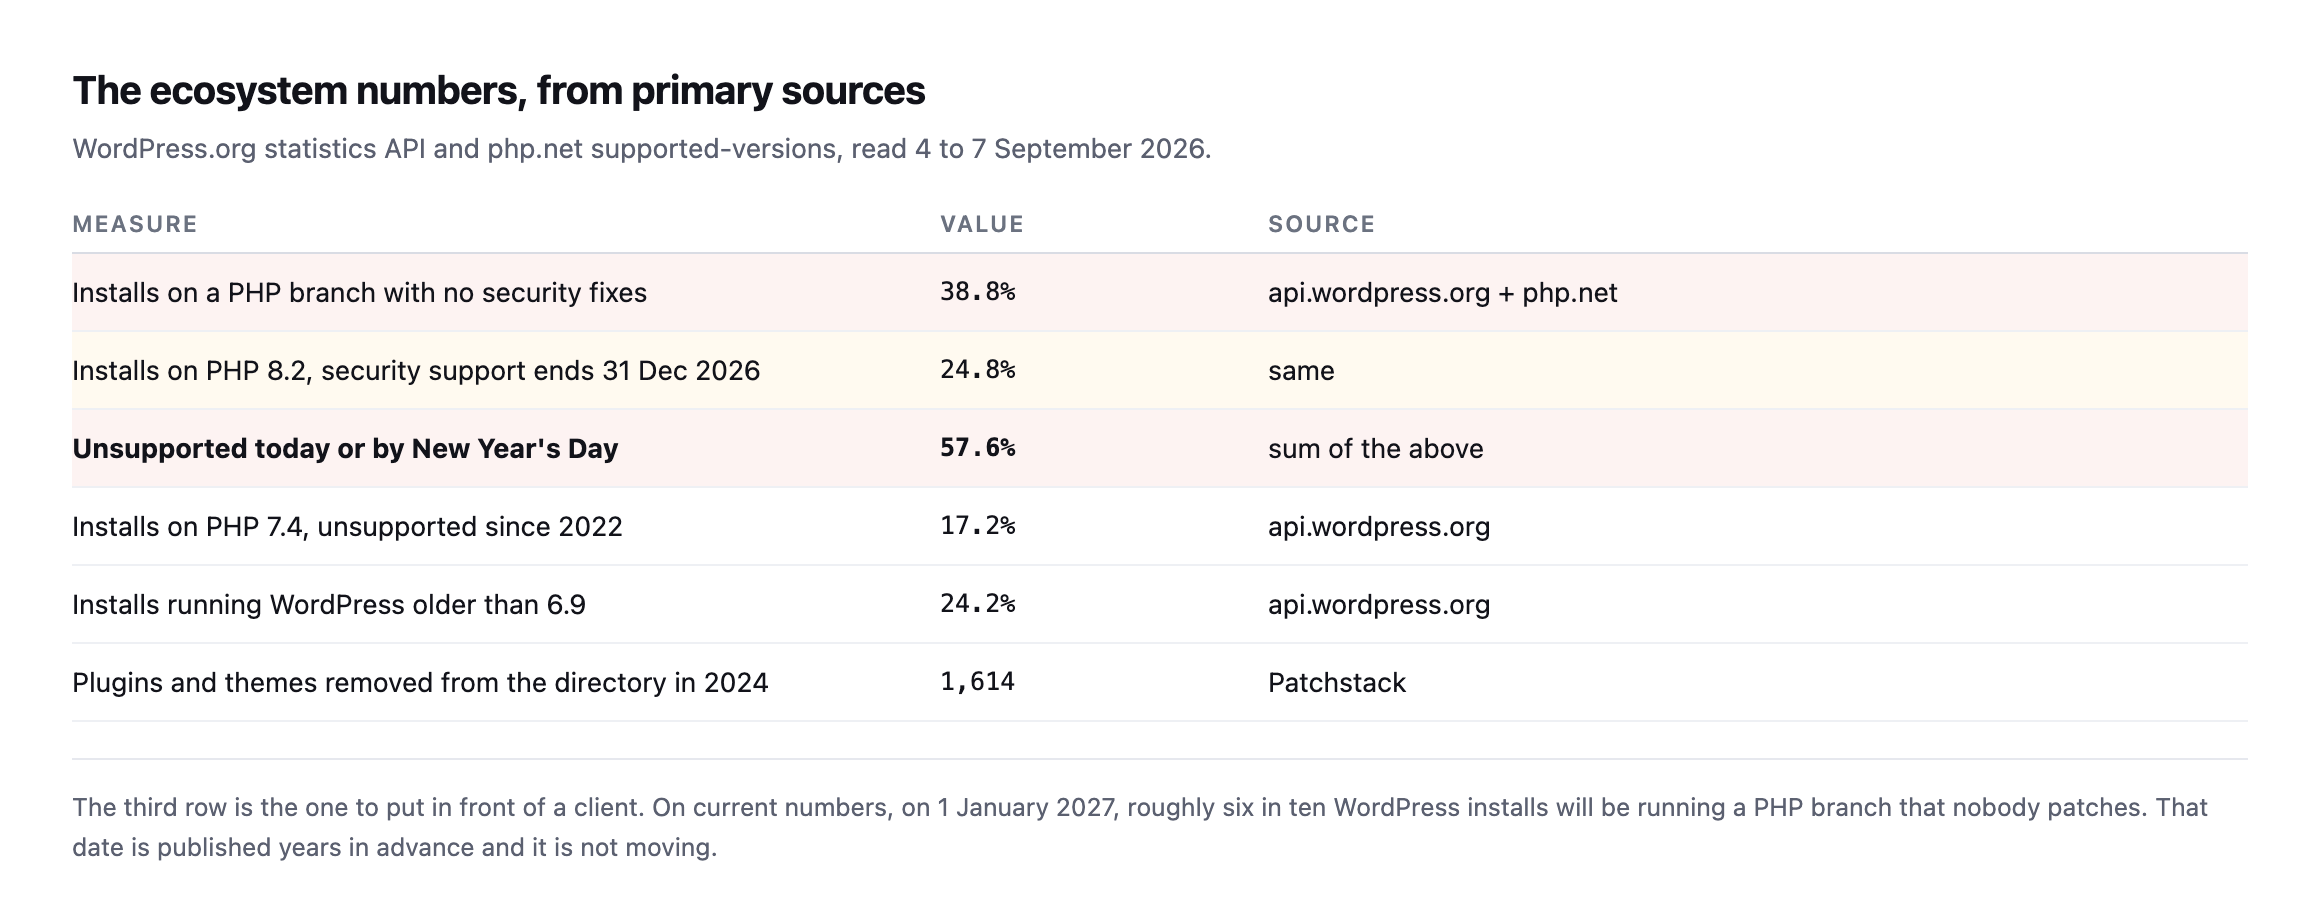
4 to 7 September 2026.*
| Measure | Value | Source |
|---|---|---|
| installs on a PHP branch with no security fixes | 38.8% | api.wordpress.org + php.net |
| installs on PHP 8.2, security support ends 31 Dec 2026 | 24.8% | same |
| unsupported today or by New Year’s Day | 57.6% | sum of the above |
| installs on PHP 7.4, unsupported since 2022 | 17.2% | api.wordpress.org |
| installs running WordPress older than 6.9 | 24.2% | api.wordpress.org |
| plugins/themes removed from the directory in 2024 | 1,614 | Patchstack |
The third row is the one worth putting in front of a client. On current numbers, on New Year’s Day, roughly six in ten WordPress installs will be running PHP that nobody patches. That date was published years in advance and it is not moving.
I have written separately about how to have that conversation without predicting a breach, because overstating it is how the advice gets discounted.
Our own portfolio
A report about other people’s sites would be worth less, so here is ours.
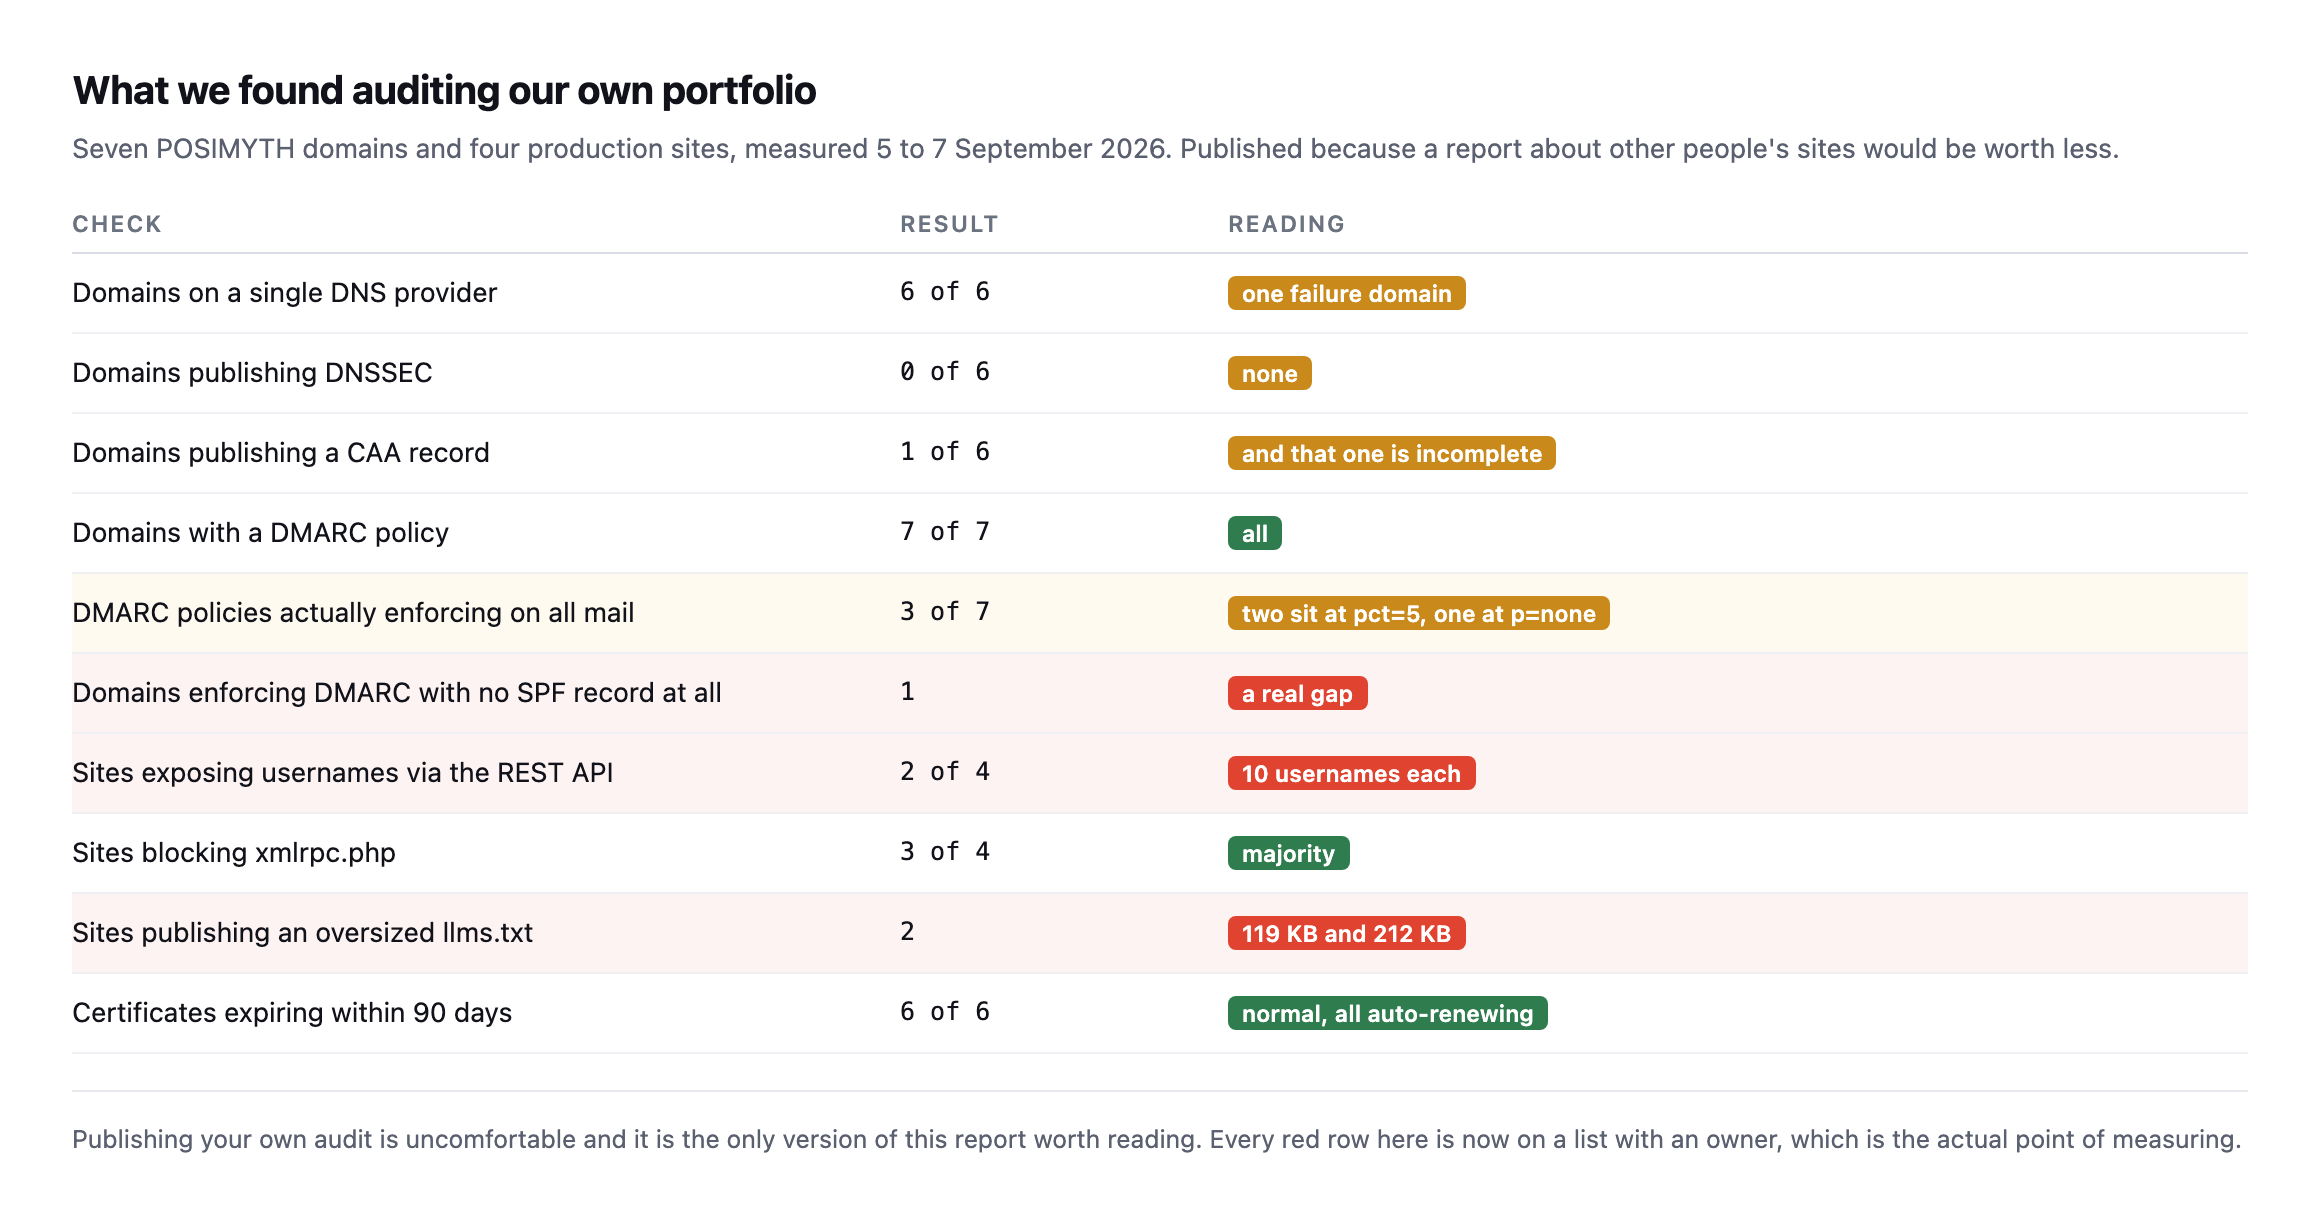
reading. Every red row is now on a list with an owner.*
| Check | Result | Reading |
|---|---|---|
| domains on a single DNS provider | 6 of 6 | one failure domain |
| domains publishing DNSSEC | 0 of 6 | none |
| domains publishing a CAA record | 1 of 6 | and that one is incomplete |
| domains with a DMARC policy | 7 of 7 | all |
| DMARC policies enforcing on all mail | 3 of 7 | two at pct=5, one at p=none |
| domains enforcing DMARC with no SPF | 1 | a real gap |
| sites exposing usernames via REST | 2 of 4 | 10 usernames each |
sites blocking xmlrpc.php | 3 of 4 | majority |
sites publishing an oversized llms.txt | 2 | 119KB and 212KB |
| certificates expiring within 90 days | 6 of 6 | normal, all auto-renewing |
Three findings I did not expect.
Two of our sites expose ten usernames each through the REST API. Not a vulnerability, and half of what a credential attack needs.
Two of our DMARC policies sit at pct=5, which applies the policy to five percent of failing mail and treats the rest as though there were no policy. That is a legitimate rollout step we stopped on and forgot.
One domain publishes a p=quarantine DMARC policy with no SPF record at all, leaving DKIM as the only thing alignment can use.
What measuring taught me about measuring
The most useful thing to come out of this was not any single number.
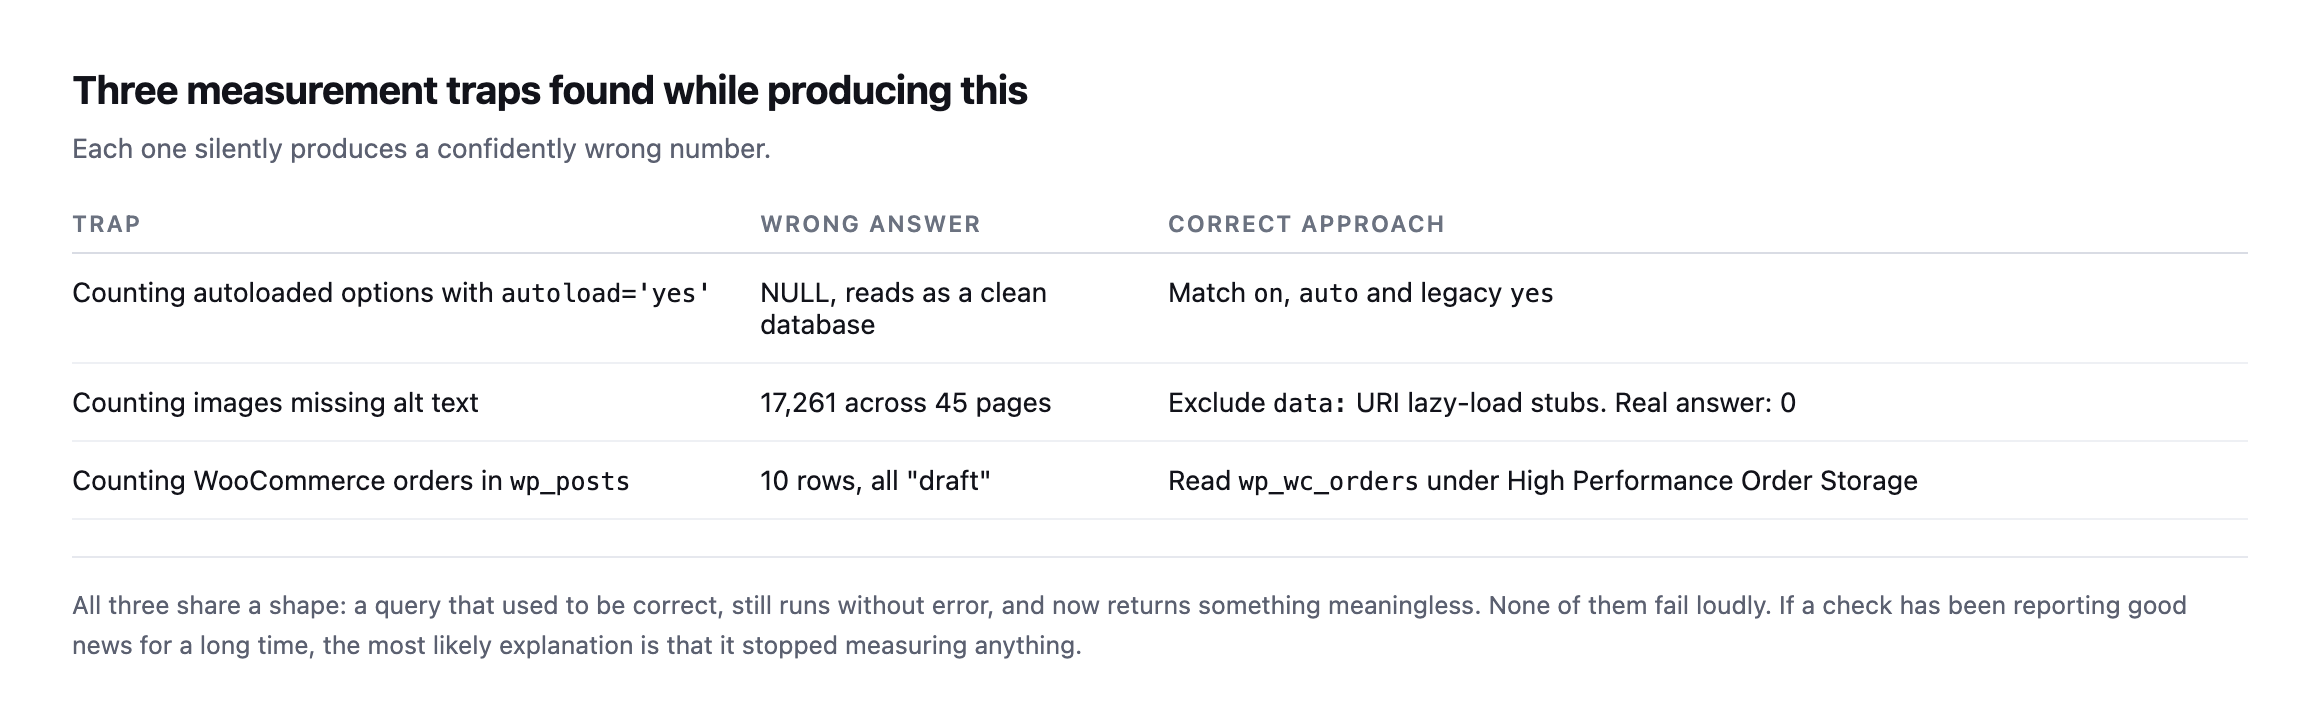
returns something meaningless.*
| Trap | Wrong answer | Correct approach |
|---|---|---|
counting autoloaded options with autoload='yes' | NULL, reads as a clean database | match on, auto and legacy yes |
| counting images missing alt text | 17,261 across 45 pages | exclude data: URI stubs; real answer: 0 |
counting WooCommerce orders in wp_posts | 10 rows, all “draft” | read wp_wc_orders under HPOS |
The alt-text one nearly went out as a headline. A crawl reported 17,261 images missing alt attributes across 45 pages. Every single one was a lazy-loading placeholder, and the real count was zero.
The lesson generalises well beyond these three: if a check has been reporting good news for a long time, the most likely explanation is that it stopped measuring anything.
What we are changing as a result
A report that produces no work is entertainment, so here is what came out of ours.
The two sites exposing usernames get display names separated from login names, which is the fix that survives future plugin changes rather than the filter that a plugin update can step around.
The two pct=5 DMARC policies get finished. They have been paused mid-rollout for long enough that nobody remembered they were paused, which is the exact failure the report exists to catch.
The domain enforcing DMARC with no SPF gets an SPF record published this week. That is the single most defective row in the table.
The two oversized llms.txt files, at 119 KB and 212 KB, get rewritten by hand. A generator produced them, and generators have no opinion about which twenty links matter.
DNSSEC and CAA get a decision rather than a fix. Both are cheap and both can break things when done carelessly, so the honest outcome is a written decision about whether we want them, not a rushed deployment because they appeared in a table.
What to check first
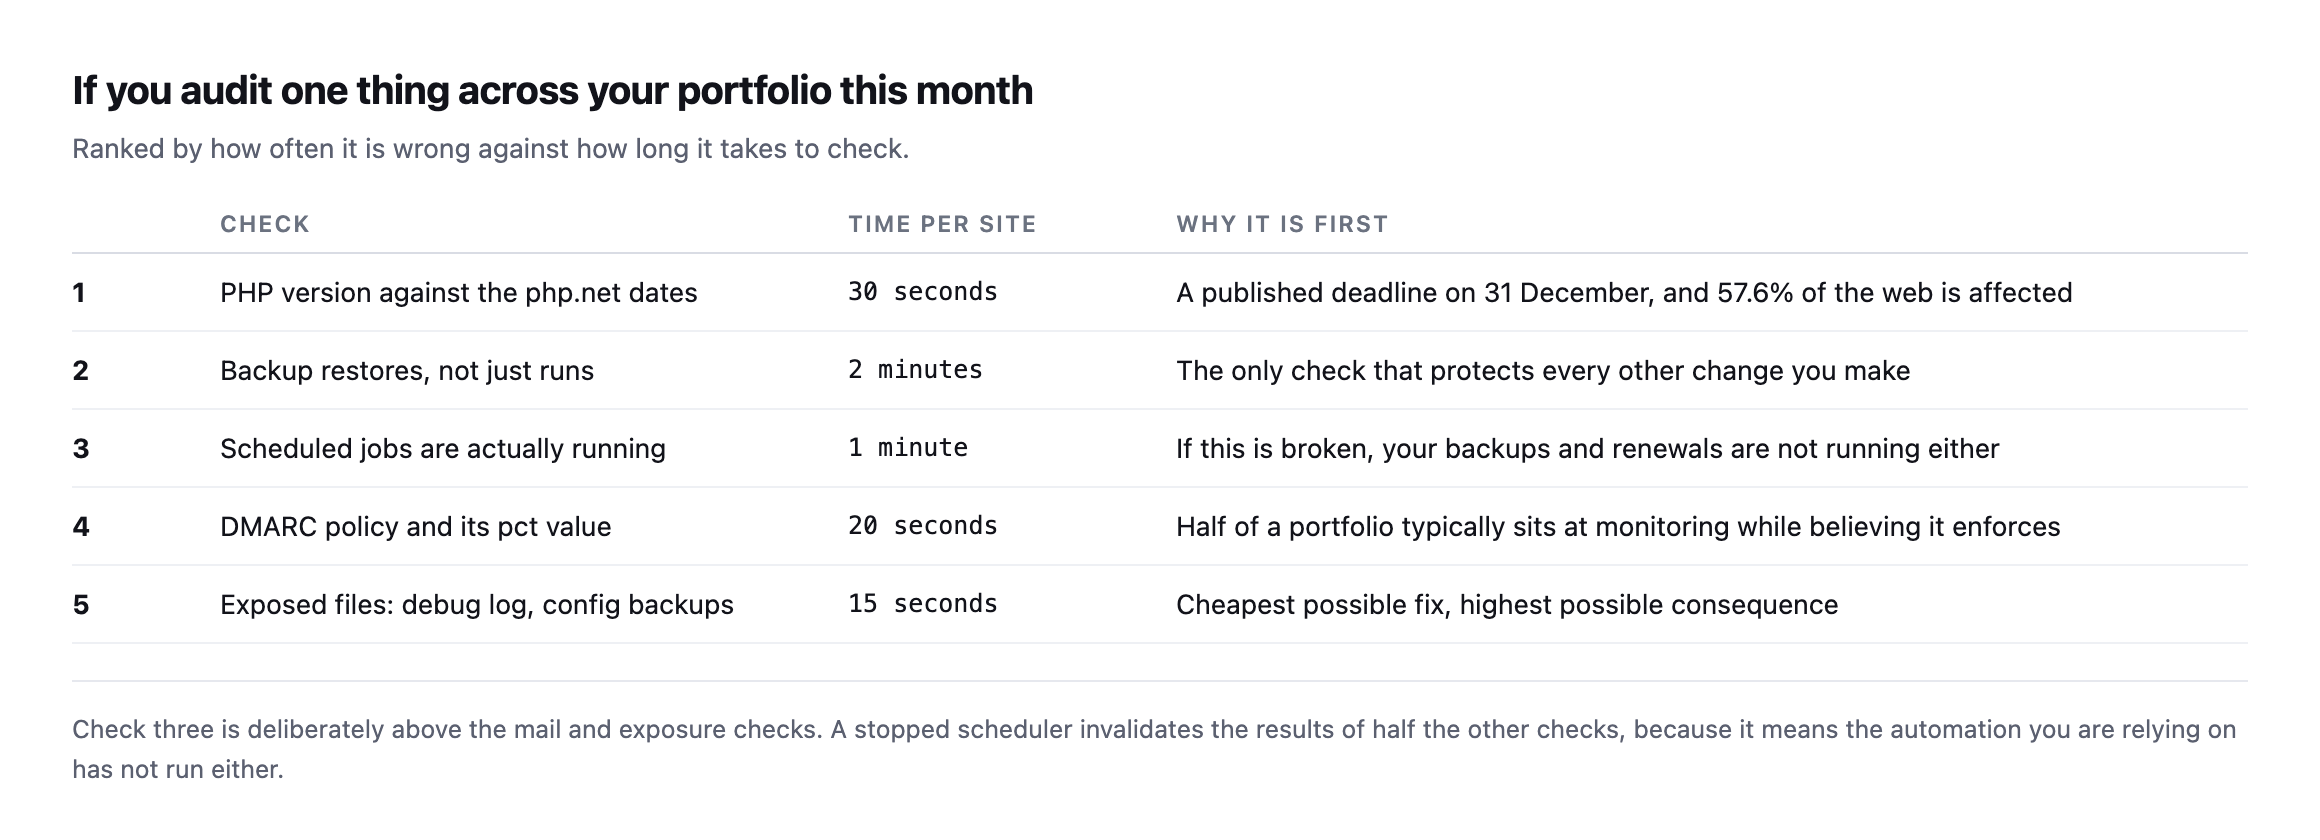
invalidates half the others, because the automation you are relying on has not run either.*
| # | Check | Time | Why it is first |
|---|---|---|---|
| 1 | PHP version against php.net dates | 30s | a published deadline, 57.6% of the web affected |
| 2 | backups restore, not just run | 2min | the only check that protects every other change |
| 3 | scheduled jobs are actually running | 1min | if broken, backups and renewals are not running either |
| 4 | DMARC policy and its pct value | 20s | half a portfolio typically sits at monitoring, believing it enforces |
| 5 | exposed files: debug log, config backups | 15s | cheapest fix, highest consequence |
Nothing on that list takes longer than two minutes per site. The total for a forty-site portfolio is an afternoon, once, and it produces a document you can act on for a year.
The second reading, taken before a month had even passed
This post closed by promising a monthly re-read, with the same numbers measured the same way, including the ones that make us look bad. I re-ran every check in the portfolio table while expanding this post rather than wait for a full month to pass, and the results are worth publishing exactly as promised.
dig +short DS "$d"      # DNSSEC
dig +short CAA "$d"     # CAA
dig +short TXT "_dmarc.$d"
DNSSEC: still 0 of 6. No change. It remains a decision nobody has made, exactly as this post already frames it.
CAA: still 1 of 6, but that one domain moved from incomplete to correct. posimyth.com‘s record now carries matching issue and issuewild entries across five certificate authorities, the specific gap this post’s original table flags, closed. The other five domains still publish none at all.
A discrepancy in this post’s own original table, worth correcting rather than quietly smoothing over: wpagentconnector.com does not have a DMARC policy. This post’s original row states “domains with a DMARC policy: 7 of 7, all.” Re-checking _dmarc.wpagentconnector.com directly returns nothing, an empty TXT lookup, while the domain does publish SPF. Either that domain’s DMARC record existed briefly and was removed sometime between the original check and this one, or the original count was wrong. I cannot determine which from here, and the honest move is to report the current, directly-verified state rather than guess at which explanation is more flattering: as of this reading, it is 6 of 7, not 7 of 7.
The ecosystem-wide PHP figure held almost exactly. Re-querying api.wordpress.org/stats/php/1.0/ directly and summing every branch with no current security support, not only the three largest, gave 38.36% against this post’s original 38.8%, a difference small enough to be ordinary day-to-day movement in a live distribution rather than a real trend in either direction. Unlike a companion post on this blog, whose narrower original figure needed an actual correction, this post’s own number was built the complete way from the start and needed none.
The two pct=5 DMARC policies are unchanged. posimyth.com and theplusaddons.com both still enforce on five percent of failing mail, the exact figure this post lists as “paused mid-rollout, forgotten.” It is still forgotten.
That overall mix, one real fix, one correction to the original post’s own accuracy, and most of the rest sitting unmoved, is precisely what a second, honest reading is supposed to surface. A monthly report that always shows uniform improvement is not measuring honestly. This one plainly does not, and that is exactly the point of running it a second time at all.
Method, so you can disagree with it
Worth stating, because a report without a method is an opinion with numbers attached.
The ecosystem figures come from api.wordpress.org/stats/php/1.0/ and the equivalent WordPress version endpoint, read directly rather than from any intermediary. Support dates come from php.net’s own supported-versions page. Both are linked above and both can be re-read by anybody.
The portfolio figures come from DNS lookups, TLS handshakes and plain HTTP requests against domains we own, run from one machine on 5 to 7 September 2026. Nothing required privileged access, which means you can run the identical checks against your own portfolio and get comparable numbers.
The limits. Eleven domains and sites is a small sample and it is ours, so it is not representative of the ecosystem. The ecosystem figures are self-reported by installs that check in with WordPress.org, which under-counts sites that block those requests. And every measurement is a single point in time.
I would rather publish a small, honest, reproducible sample than a large one nobody can check.
The pattern underneath all of it
Every finding in this report is the same kind of failure. Nothing crashed. No error appeared. Every site returned 200 throughout.
A DMARC policy that enforces on five percent of mail looks identical to one that enforces on all of it. A backup that will not restore sits in the folder next to one that will. A scheduler that stopped in March produces exactly as many alerts as one running perfectly, which is none.
That is the whole argument for measuring on a schedule rather than reacting to alerts. The failures that cost agencies money do not announce themselves, and the only thing that finds them is somebody looking on a day when nothing appears to be wrong.
Protuno’s free audit runs 54 read-only checks from a domain alone, which is where most of the externally-visible numbers above came from. Straight with you as on every post here: the Super Agents that would run this continuously are built and named but not live yet.
I intend to publish this monthly, with the same numbers measured the same way, including the ones that make us look bad. A single reading tells you very little. The second one tells you which direction things are moving.
Comments