WordPress Uptime Monitoring: The Playbook, Step By Step.
A 200 status code is not the same as a working WordPress site. I served three broken pages to three kinds of check. Here is what each one sees.

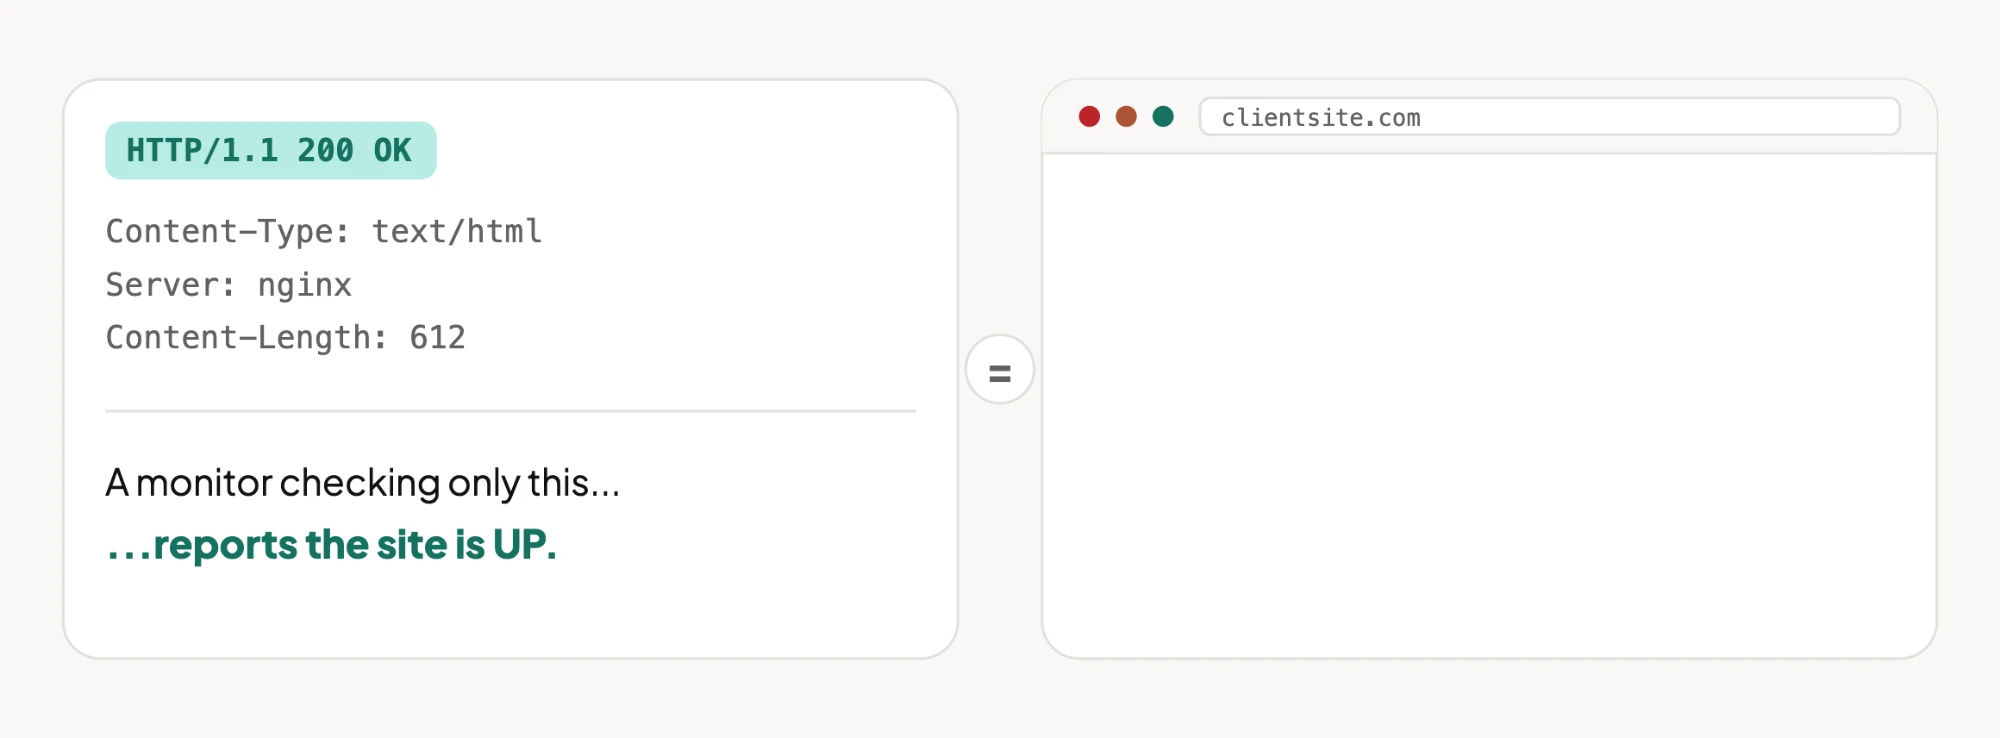
Somewhere right now, a monitoring dashboard is glowing green for a site that is showing a client a blank white page. I served three broken pages from a test server and checked what three kinds of check would say.
Short answer: a status-code check calls all three broken pages healthy, because all three return 200. I served them from a small test server and ran three kinds of check against the same responses. The status-code check missed every one. An error-word check caught only the fatal error. A check that looks for text the healthy page should contain caught all three, but somebody has to keep that text up to date.
What this test is, and is not: the pages come from a 20-line local test server that returns the responses a broken WordPress site would (an uncaught PHP error printed as text, an empty body, a placeholder page). It shows what each kind of check can see. It is not a WordPress install, and I did not test any vendor’s product.
The Check Nobody Questions
“Is the site up?” feels like a solved problem, the kind of thing you set up once and forget. Point a monitor at the homepage, ping it every few minutes, get a message if it stops answering. Many hosts, security plugins and budget monitoring tools default to exactly this.
Here’s the part that should bother you more than it does: “up” to that monitor just means a server opened a connection and handed back a number under 400. That’s it. Nobody ever taught it what your homepage is supposed to look like. It’s a bouncer checking that the door opens, not checking who walked through it.
Three Ways A WordPress Site Returns 200 While Being Broken
These failure modes are common enough that most agencies have met at least one of them. Each produces a response the server is happy to label 200 OK.
- A fatal PHP error with
display_errorsleft on. The server returns 200, the visitor gets a stack trace where the homepage used to be, and a status-code monitor waves it through. - A plugin conflict producing a white screen. No error text, no clue, just an empty
<body>and a 200 status sitting on top of nothing. - A homepage overwritten by a template import or a failed migration. The page loads instantly, returns 200, and is completely the wrong page: a placeholder, a builder’s default template, last month’s cache.
A status-code monitor sails through all three. A person notices straight away. Guess which one your client trusts more.
Three Checks, Three Broken Pages
I served the three broken pages plus one healthy page from the test server and ran three kinds of check against each. Everything in the table below was measured that way.
| Check | Fatal error page | White screen | Wrong homepage | Healthy page |
|---|---|---|---|---|
| A. Status code only (alert if not 2xx) | No alert | No alert | No alert | No alert |
| B. Alert if the page contains an error word (“Fatal error”) | Alert | No alert | No alert | No alert |
| C. Alert if expected text (“Welcome”) is missing | Alert | Alert | Alert | No alert |
Row B is the one worth sitting with, because it looks like the problem solved itself. It only catches the failure that announces itself. A white screen has no words to match. A wrong homepage has plenty of words, just not yours.
Row C is the good one, and it has a price. Somebody has to choose the expected text, keep it in sync every time the homepage changes, and repeat that for every site. When the copy changes and nobody updates the check, it raises a false alarm, and false alarms are how monitoring gets muted.
The Playbook, Step By Step
Uptime Checker is a Protuno playbook: a fixed sequence written down before it runs, so it does the same thing this Tuesday that it did last Tuesday.
Here is the sequence, published in full.
The playbook has seven steps:
| # | Step |
|---|---|
| 1 | Uptime Config Gate |
| 2 | Ensure UptimeRobot Keyword Monitor |
| 3 | External Vantage Read UptimeRobot |
| 4 | On Site Probe And Classification |
| 5 | Uptime Confirmation Loop |
| 6 | Vantage Point Report |
| 7 | Fleet Verdict And Report |
Step 2 sets up a keyword monitor, which is the “expected text” idea from row C above. Step 5 is a confirmation loop, which is the “re-check before alerting” idea from the fixes table below.
It is in beta, it only reads the site, and it needs UptimeRobot connected to work. I have not run it. It is not switched on for any site yet, so this post carries no timings and no results from it. The only measured numbers here are from the local test above.
The three-check test above is why a sequence beats a single check: a status code misses all three broken pages, an error word misses two, and even the expected-text check only works while someone keeps that text current.
What to ask of any monitor, this one included:
- Does it check the page, or only the response code?
- If it checks the page, who maintains what it expects to see?
- Does it re-check before alerting, so one network blip doesn’t wake anyone up?
- Can it tell a replaced homepage from the real one?
Testing What Your Current Setup Actually Catches
Two checks, no tooling required beyond curl.
Does your monitor look past the status code?
curl -s -o /dev/null -w "%{http_code}\n" https://yoursite.comThis alone tells you nothing except what your current monitor is probably already checking. The real test is what happens next.
Simulate a silent content failure. Temporarily rename your active theme’s functions.php (on staging, not production) and watch whether your monitor says anything within its stated interval. A status-code-only monitor will report the site is up the entire time your visitors are seeing a fatal error or a blank page.
If your monitor stays green through that test, it is checking the pipe, not the page.
Which Row Is Your Monitor?
Once you’ve run the functions.php test, match what happened to a row of the table above. That tells you what your monitor can and cannot see, and what to do next.
| What happened in your test | You’re running | What it will miss | Next step |
|---|---|---|---|
| Nothing. It stayed green. | Row A: status code only | All three failures in this post | Add an expected-text check (step 2 below) |
| It alerted on a fatal error page, but stayed quiet on a blank one | Row B: error word present | White screens and wrong homepages | Flip the rule to “expected text is missing” (step 2 below) |
| It alerted on every broken page | Row C: expected text missing | Nothing in this test, but the text goes stale when the homepage changes | Write the expected text down and review it whenever the homepage changes (step 3 below) |
| It alerts on healthy pages too | Row C with stale text | Trust. The team learns to ignore it. | Update the expected text, then re-check from a second location before alerting (steps 3 and 4 below) |
Fixing It In The Right Order
| # | Step | Why here |
|---|---|---|
| 1 | Turn off display_errors in production, whatever monitoring you run | A stack trace is a separate leak, not just a monitoring gap |
| 2 | Add an expected-text check to the uptime tool you already use, if it supports one | Turns a pipe check into a page check (row C above) |
| 3 | Write the expected text down where the whole team can find it | It goes stale the day the homepage changes |
| 4 | Re-check from a second location before trusting an alert | One flaky network path is what trains people to mute the whole system |
What I’d Do With A Client Portfolio This Week
Pick your five busiest sites. Break one on purpose: rename functions.php on a staging copy, nothing production, nothing dramatic, and time how long your current monitoring takes to say a word about it. Set a timer. Walk away. Come back in twenty minutes.
If the timer never goes off, you’ve found the gap this post is about. If it does, you have a monitor worth keeping.
This is the same blind spot WordPress Cron Not Running covers from a different angle: the server doing exactly what it was told, faithfully, while the thing that actually matters quietly stops happening. SSL Certificate Expiry is the same trap on a calendar, and WooCommerce Checkout Monitoring is where it costs the most: a homepage that loads perfectly while checkout is broken. All of them circle the same idea: a system can report perfect health and still be lying to you, not out of malice, just out of asking the wrong question.
Uptime Checker is one of Protuno’s playbooks. See the playbook list.
So, one honest question before you close this tab: the last time something actually broke on one of your sites, how did you find out? If the answer involves the words “a client emailed me,” you already know which row of that table you’re running.
Comments