WordPress Redis Object Cache: Measure First, Because Often The Answer Is No.
We measured 70 to 77 queries per page at 8 to 15 milliseconds. On that site an object cache saves nothing a visitor could notice.

Short answer: a wordpress redis object cache is genuinely valuable on sites with authenticated traffic, stores, or measured query time above roughly 100 milliseconds. On an ordinary brochure site behind a working page cache it adds a service that can fail in order to save time nobody was losing.
The measurement takes ten minutes and decides it for you.
Measuring before deciding
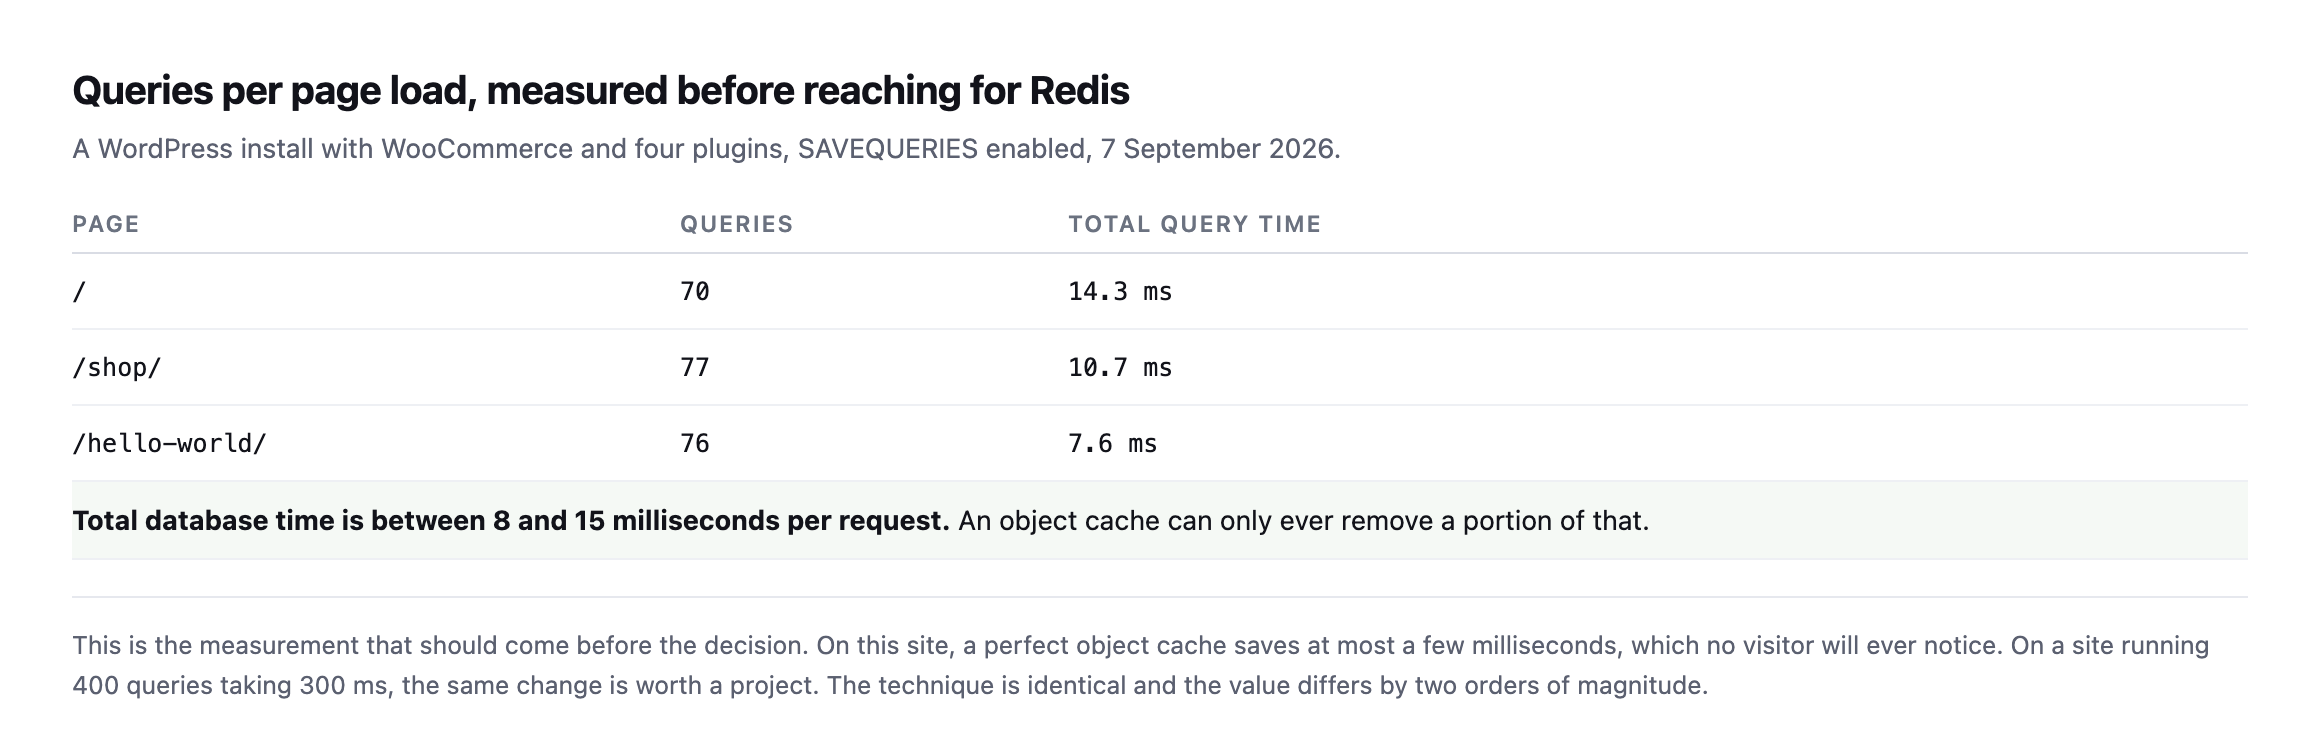
SAVEQUERIES on 7 September 2026. Total database time is between 8 and 15milliseconds per request. A perfect object cache can only ever remove a portion of that.*
On this site, the honest recommendation is to do nothing. Nobody perceives eight milliseconds.
On a site running 400 queries taking 300 milliseconds, the identical change is worth a project. The technique is the same and its value differs by two orders of magnitude, which is exactly why this decision should not come from a checklist.
Measure it yourself by adding define('SAVEQUERIES', true); to wp-config.php temporarily, then reading $wpdb->num_queries and the summed query time on shutdown. Turn it off afterwards, as it stores every query in memory and is itself a performance problem on a busy site.
What a WordPress Redis object cache actually changes
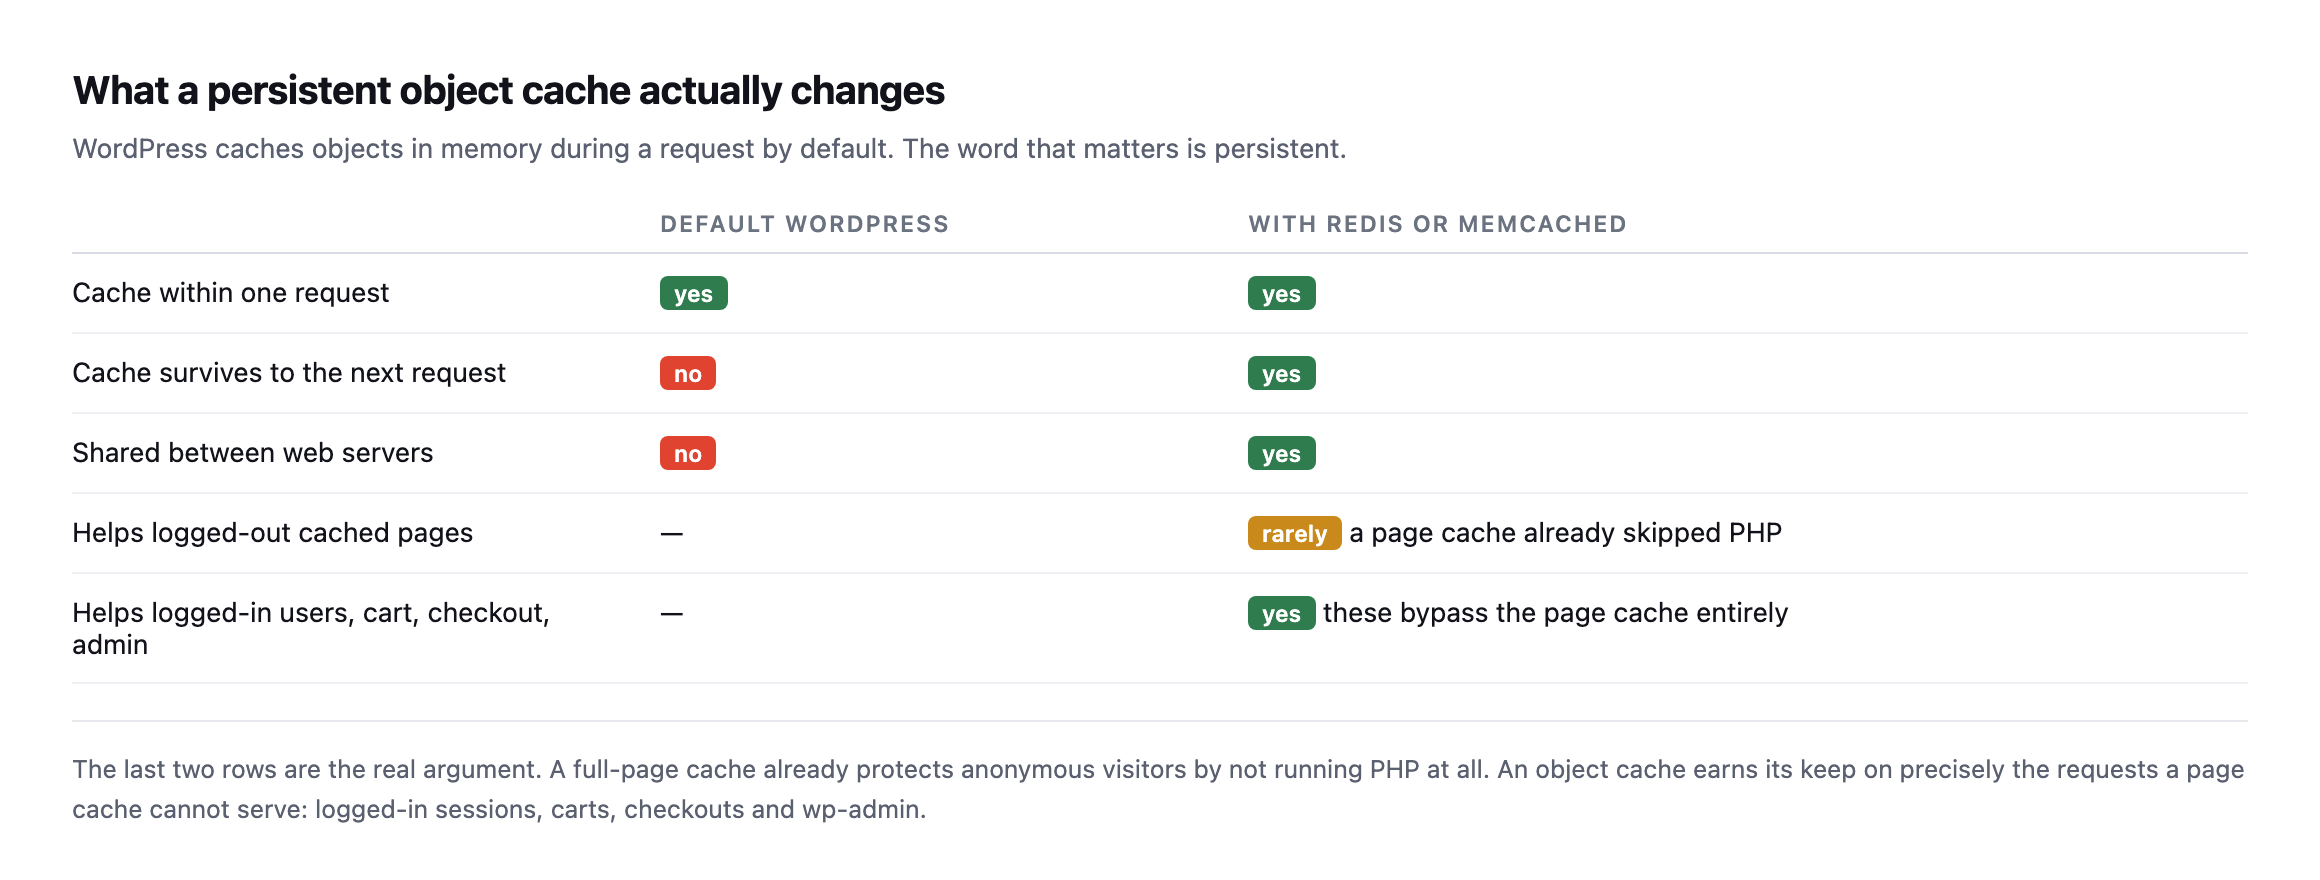
visitors by not running PHP at all. An object cache earns its keep on the requests a page cache cannot serve.*
| Default WordPress | Redis / Memcached | |
|---|---|---|
| cache within one request | yes | yes |
| cache survives to the next request | no | yes |
| shared between web servers | no | yes |
| helps logged-out cached pages | n/a | rarely, a page cache already skipped PHP |
| helps logged-in users, cart, checkout, admin | n/a | yes, these bypass the page cache entirely |
This is the point most often missed. WordPress already caches objects in memory within a single request. Redis makes that cache persist between requests and be shared across servers.
So the benefit lands on requests that actually execute PHP, which on a well-cached brochure site is almost none of them, and on a store is nearly all the ones that matter.
When it is worth it
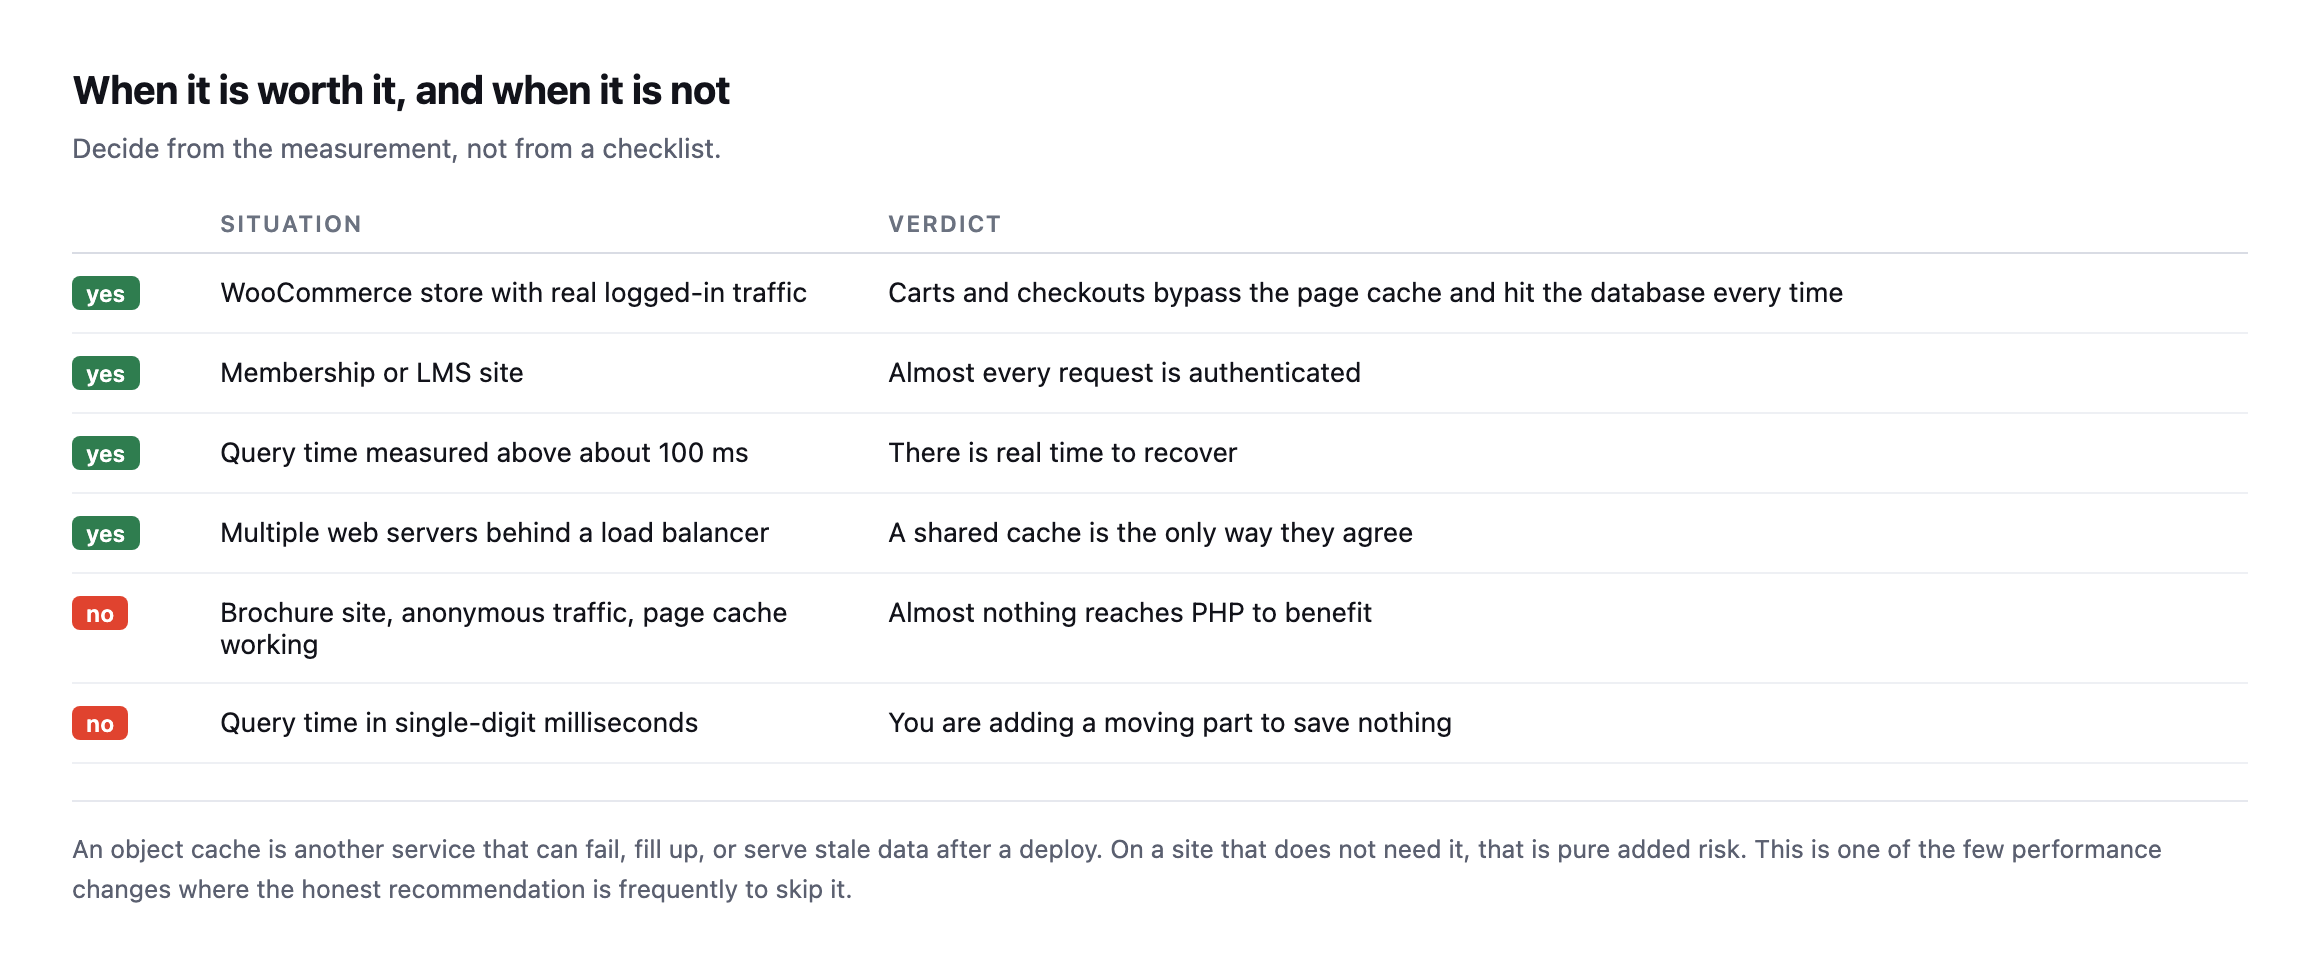
deploy. On a site that does not need it, that is added risk for no return.*
| Situation | Verdict | |
|---|---|---|
| yes | WooCommerce store with real logged-in traffic | carts and checkouts hit the database every time |
| yes | membership or LMS site | almost every request is authenticated |
| yes | query time measured above ~100ms | real time to recover |
| yes | multiple web servers behind a load balancer | a shared cache is the only way they agree |
| no | brochure site, anonymous traffic, page cache working | almost nothing reaches PHP to benefit |
| no | query time in single-digit milliseconds | adding a moving part to save nothing |
Installing Redis and measuring the actual before and after
Everything above describes what an object cache should do. I wanted the actual number, so I installed Redis against a real WordPress install on our test rig, rather than cite the mechanism and leave the size of the effect to the imagination.
wp plugin install redis-cache --activate
wp config set WP_REDIS_HOST lab-redis-1
wp redis enable
wp redis status   # Status: Connected, Drop-in: Valid, Ping: PONG
With the drop-in connected and confirmed, I requested the homepage with SAVEQUERIES on and read the query count off a response header on each request:
| Request | Object cache | Queries |
|---|---|---|
| 1st (cold, cache just enabled) | on | 138 |
| 2nd | on | 14 |
| 3rd | on | 14 |
| 4th | on | 14 |
| baseline, cache disabled | off | 142 |
Queries dropped from 142 to 14 once Redis had something in it to serve, a reduction of roughly 90%. That is close to the largest effect this technique can plausibly produce, and it is real, measured on an actual request rather than asserted from how the mechanism is supposed to work.
The honest second half of the result is the wall-clock time for the same requests, and it is the more important number for this post’s argument:
| Request | Object cache | Total time |
|---|---|---|
| 1st (cold PHP, no cache) | off | 0.740s |
| 2nd | off | 0.196s |
| 3rd | off | 0.141s |
| 1st (warm cache) | on | 0.211s |
| 2nd | on | 0.201s |
| 3rd | on | 0.179s |
A 90% cut in query count did not produce anything close to a 90% cut in response time. Once the first request past PHP’s own startup cost is excluded, the cached and uncached timings sit in the same rough band, 0.14 to 0.21 seconds, on this specific install. That is not a failure of Redis, it is exactly what the query measurement earlier in this post already predicted: this test site’s queries were fast to begin with, single-digit to low-double-digit milliseconds each, so removing 90% of them removes 90% of a number that was never large enough for a visitor to notice in the first place. The query count is a mechanism metric. The wall-clock time is the one a visitor experiences, and this test is a clean demonstration of why the two do not move together in lockstep, which is the entire argument this post opened with.
Testing the case this post says matters most
The homepage test above is close to the “no” case this post describes: anonymous, cacheable, low query count to begin with. The more relevant test for the “yes” case is a request that always executes PHP regardless of any page cache, so I measured the WooCommerce Store API cart endpoint, which is session-scoped and, per that post’s own testing, never served from a cache:
curl -s -o /dev/null -D - "http://localhost:8080/wp-json/wc/store/v1/cart" | grep -i x-db-queries| Request | Object cache | Queries |
|---|---|---|
| baseline | off | 152 (cold), 138, 138 |
| warm | on | 14, 14, 14 |
The same roughly 90% reduction as the homepage test, on an endpoint that, unlike the homepage, cannot be served by a page cache on a real production site with real carts in them. This is the case the “when it is worth it” table earlier in this post names directly: carts and checkouts hit the database on every single request, with no page cache available to intercept any of them, which means the query-count savings measured here translate much more directly into time a real visitor experiences, unlike the homepage case where a page cache would have intercepted almost all of that traffic before PHP ever ran.
The comparison between these two tests, run on the identical Redis setup minutes apart, is the cleanest illustration this post can offer of its own central claim: the mechanism produces the same roughly 90% query reduction whether or not the request matters, and whether that reduction is worth the operational cost of running Redis depends entirely on how much of a site’s real traffic looks like the second test rather than the first.
If you do install one
Three things that cause the support tickets.
Set a memory limit and an eviction policy. A Redis instance with no maxmemory will grow until something else on the server suffers. allkeys-lru is the usual choice for a cache.
Flush it on deploy. Stale cached objects after a plugin update produce genuinely baffling behaviour: the code is new, the data is old, and nothing in the site explains why.
Check it is actually connected. Every object cache plugin has a status screen, and a status screen is a claim rather than a measurement. Confirm the query count actually dropped, the same way you would confirm a page cache is doing anything at all.
The wider point
Object caching is the clearest example of a performance change that gets applied because it is on a list rather than because it was measured. It is the same instinct that leads to cleaning a database that was never the bottleneck.
Start with where the time is going. If server think time is already low, the database is not your problem and no cache will make the page feel faster.
Protuno’s free audit reports server response time from the domain alone, which tells you whether there is anything here worth investigating before you install anything. Straight with you as on every post here: Dash, the Performance agent, is built and named but not live yet.
Measure the query count on one client site this week. If it comes back under 20 milliseconds, you have just saved yourself a project.
What running this test actually took
Worth being specific about the setup, because it is smaller than the phrase “set up a Redis benchmark” suggests, and it is the kind of test worth running against a real client site’s staging copy rather than trusting a number from this post.
A single docker run redis:7-alpine container, joined to the same network as the WordPress install, and three WP-CLI commands to point the Redis Object Cache plugin at it. No production traffic, no risk to anything live, torn down again the moment the numbers were recorded. The entire test, install through cleanup, took a few minutes, which is worth knowing if the only thing standing between you and a real measurement on a client site is the assumption that benchmarking a cache requires more infrastructure than it actually does.
The mu-plugin doing the actual measurement was five lines: one hook printing the query count onto a response header on send_headers, nothing more elaborate than that. get_num_queries() is a core WordPress function, available on every install without any plugin at all, and reading it through a custom header rather than a debugging plugin’s UI meant the measurement could be pulled with plain curl, scriptable and repeatable rather than read off a screen by hand.
Why the two tests told different stories from the same cache
It is worth sitting with the gap between the homepage result and the cart endpoint result a second time, because it is the actual argument of this post compressed into two rows of a table rather than a paragraph of reasoning.
Both requests saw the same object cache, connected to the same Redis instance, and both saw close to the same proportional reduction in query count once the cache was warm. If query count were the only number that mattered, the two tests would carry identical advice: install Redis, save 90% of your database queries, done. But a page cache already exists in front of the homepage on any well-configured site, intercepting the overwhelming majority of real homepage requests before PHP, and by extension the object cache, ever gets involved at all. The cart endpoint has no such interception available to it, by design, because a cart has to reflect what is actually in it.
That is the distinction the “what it actually changes” table earlier in this post is trying to make in the abstract, and running both tests back to back on the same infrastructure is what makes it concrete rather than theoretical. The mechanism does not know or care which kind of request it is serving. It reduces queries by roughly the same proportion either way. Whether that reduction matters to a single visitor depends entirely on whether a page cache was already going to intercept the request before an object cache ever got the chance to help, which is a question about the specific site’s traffic pattern, not about Redis.
Comments