WordPress TTFB: The Number Everyone Quotes And Almost Nobody Measures Properly.
We measured TTFB on three real sites and bypassed their caches. One got 9x slower. Here is what the number is made of and which part you can fix.

Short answer: wordpress ttfb is not a measure of your server. It is DNS, plus a TCP connection, plus a TLS handshake, plus however long the server took to think. Only the last part is yours. And if you measured it as an ordinary visitor, you may have measured a cache rather than the site at all.
I do this measurement often at POSIMYTH, usually when somebody sends me a number and asks whether it is bad.
The honest answer is almost always: I cannot tell yet.
What the number is actually made of
Here are three real sites measured from the same machine, minutes apart, with the time split into its parts.
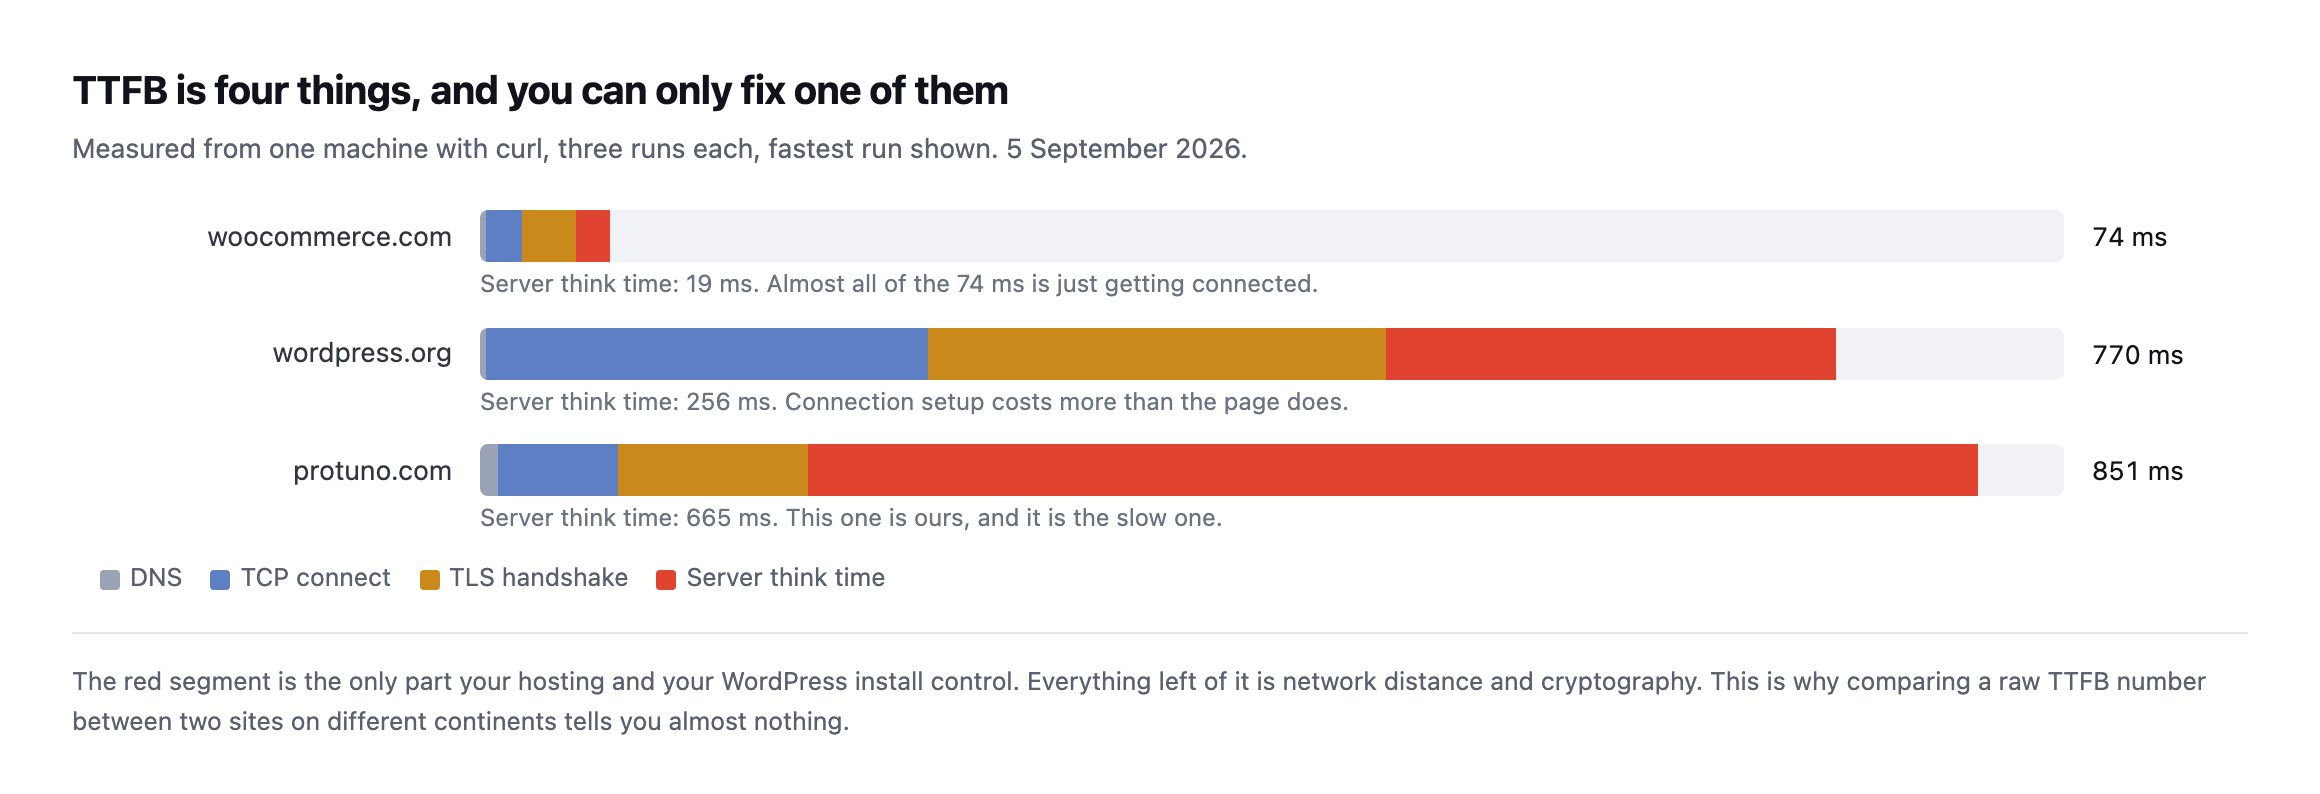
segment is server think time, and it is the only segment your hosting and your WordPress install control. Yes, the slowest one is ours.*
Look at woocommerce.com. Total 74ms, of which the server spent 19ms.
The other 55ms was getting a connection open. No amount of caching plugin will change that part, because it is the speed of light and some certificate maths.
Now look at ours. 851ms total, 665ms of it server think time.
That is a genuinely different problem from wordpress.org’s 770ms, where the server accounted for 256ms and the connection setup for the rest. Two similar totals. Two unrelated causes.
This is why a bare TTFB comparison between two sites is close to meaningless. A site in Frankfurt measured from Mumbai will lose to a worse-built site next door.
The mistake that makes the number a lie
Here is the part I care most about, because it is the one that produces confidently wrong client reports.
When you load a site normally, you may be talking to a cache. So you are measuring the cache.
Append a query string nobody has ever requested and the cache has to go to the origin:
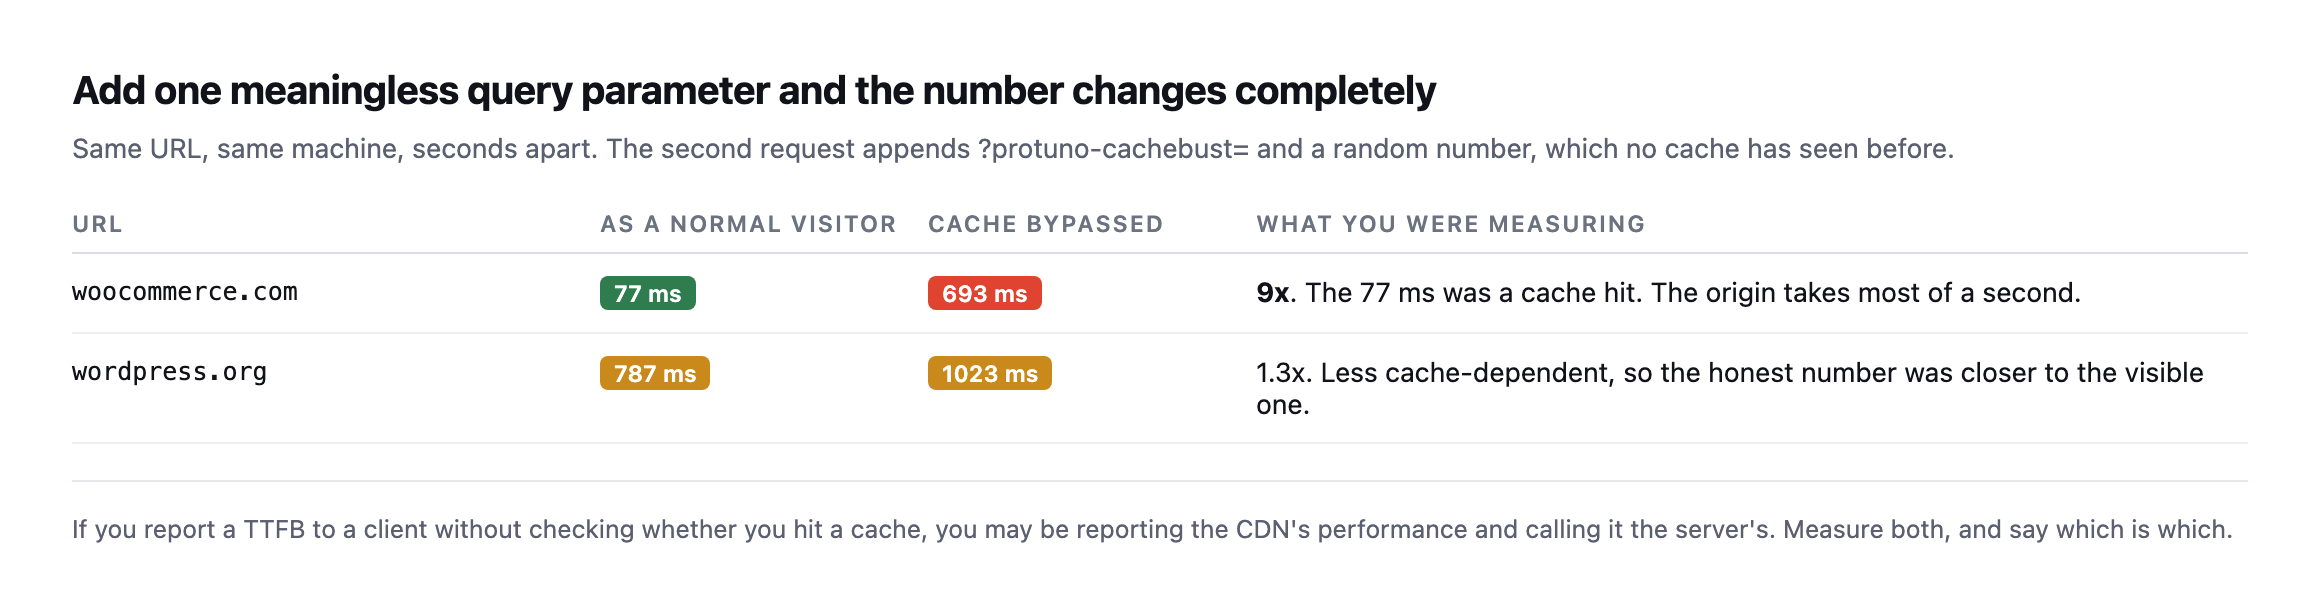
stop letting it answer from cache. That 77ms was real for visitors and completely wrong as a description of the server.*
Nine times.
Both numbers are true. They answer different questions. The cached number tells you what a visitor experiences. The bypassed number tells you what happens when the cache misses, which is exactly what happens to the first visitor after every deploy, every purge, and every uncached page like a cart or a checkout.
If you only ever measure the first one, you will be surprised by the second one on a Friday.
The same comparison as text:
| URL | As a visitor | Cache bypassed | What you were measuring |
|---|---|---|---|
| woocommerce.com | 77ms | 693ms | 9x. The 77ms was a cache hit; the origin takes most of a second. |
| wordpress.org | 787ms | 1023ms | 1.3x. Less cache-dependent, so the visible number was closer to honest. |
Caveat: two sites, one machine, one point in time. This is not a claim about what percentage of WordPress sites hide a slow origin behind a cache. It is a demonstration that the gap can be nine times, which is reason enough to check your own site before quoting a visitor-facing number as if it described your server.
How to measure WordPress TTFB properly, in one command
curl -s -o /dev/null \
  -w 'dns=%{time_namelookup}  tcp=%{time_connect}  tls=%{time_appconnect}  ttfb=%{time_starttransfer}\n' \
  https://example.com/
Read it as differences, not as four separate numbers:
- DNS is
time_namelookup - Connect is
time_connectminus DNS - TLS is
time_appconnectminustime_connect - Server think time is
time_starttransferminustime_appconnect
That last subtraction is the whole trick, and it is the number worth writing down.
Then run it again with ?cachebust=$RANDOM on the end and write down both.
Run it three times, take the fastest, and note where you measured from. A single sample from a café wifi is not a measurement.
The number a browser actually experiences is not this one
Every TTFB figure so far, including the ones in the chart above, describes one fresh request: new DNS lookup, new TCP handshake, new TLS negotiation. That is the honest number for the first resource a visitor’s browser requests. It is not what happens to the second one.
I requested two pages from the same host in a single connection, so the second request reused the TCP and TLS session the first one had already paid for, and measured both.
| Site | Request | Connect | TLS | TTFB |
|---|---|---|---|---|
| wordpress.org | first (fresh connection) | 299ms | 661ms | 1,012ms |
| wordpress.org | second (same connection, reused) | 0ms | 0ms | 353ms |
| protuno.com | first (fresh connection) | 86ms | 166ms | 823ms |
| protuno.com | second (same connection, reused) | 0ms | 0ms | 292ms |
Measured with curl’s connection reuse across two requests in a single invocation, 7 September 2026.
On both sites, the second request landed at roughly a third of the first one’s TTFB, because connect and TLS both dropped to zero. This is not a trick or an optimisation anybody configured. It is what HTTP keep-alive does by default, and it is exactly what a real browser does when it loads a page and then fetches a second resource, a stylesheet, a font, an API call, from the same origin.
Caveat: two sites, one connection-reuse test each. The percentage improvement will vary by how expensive that particular site’s TLS handshake is; the mechanism does not. Any TTFB measurement tool that opens a brand new connection for every single request, which is most of them by default, is reporting the worst case a visitor experiences, not the typical one.
The practical consequence: a synthetic monitor’s TTFB number is almost always the pessimistic end of what real visitors feel, because most monitors measure exactly once per check, cold. A returning visitor, or a visitor loading a second page in the same session, experiences something closer to the reused-connection row. Neither number is wrong. They are answers to different questions, and a report that only shows one of them is quietly picking which question to answer.
There is a practical use for this beyond understanding the number, and it is the reason I built the test this way rather than settling for the single-request chart earlier in this post. If you want to know how much of a site’s slowness is connection overhead versus origin slowness, the reused-connection measurement isolates it directly, cleanly, without guessing, and without touching a single line of the site’s own code, and without needing credentials, server access, or anything beyond a terminal and the domain name itself. Subtract the reused TTFB from the fresh one, and what is left over is almost entirely TCP and TLS setup cost, the part no amount of WordPress optimisation touches. On wordpress.org that gap was 659ms out of 1,012ms, well over half the total, and on protuno.com it was 531ms out of 823ms, close enough to the same proportion that I would not treat the exact percentage as a universal constant, only as a reliably large share. A site spending most of its measured TTFB on connection setup needs a CDN or a server closer to its visitors, not a caching plugin, and this two-request test is how you find out which one you are looking at before you spend a weekend on the wrong fix. Optimising a plugin queue on a site whose real problem is a TLS handshake three time zones away wastes an afternoon and changes nothing a visitor notices, and this test tells you which weekend you are actually signing up for, in under a minute, before you commit to either one.
Read the headers before you believe anything
Before diagnosing, find out whether a cache was involved at all.
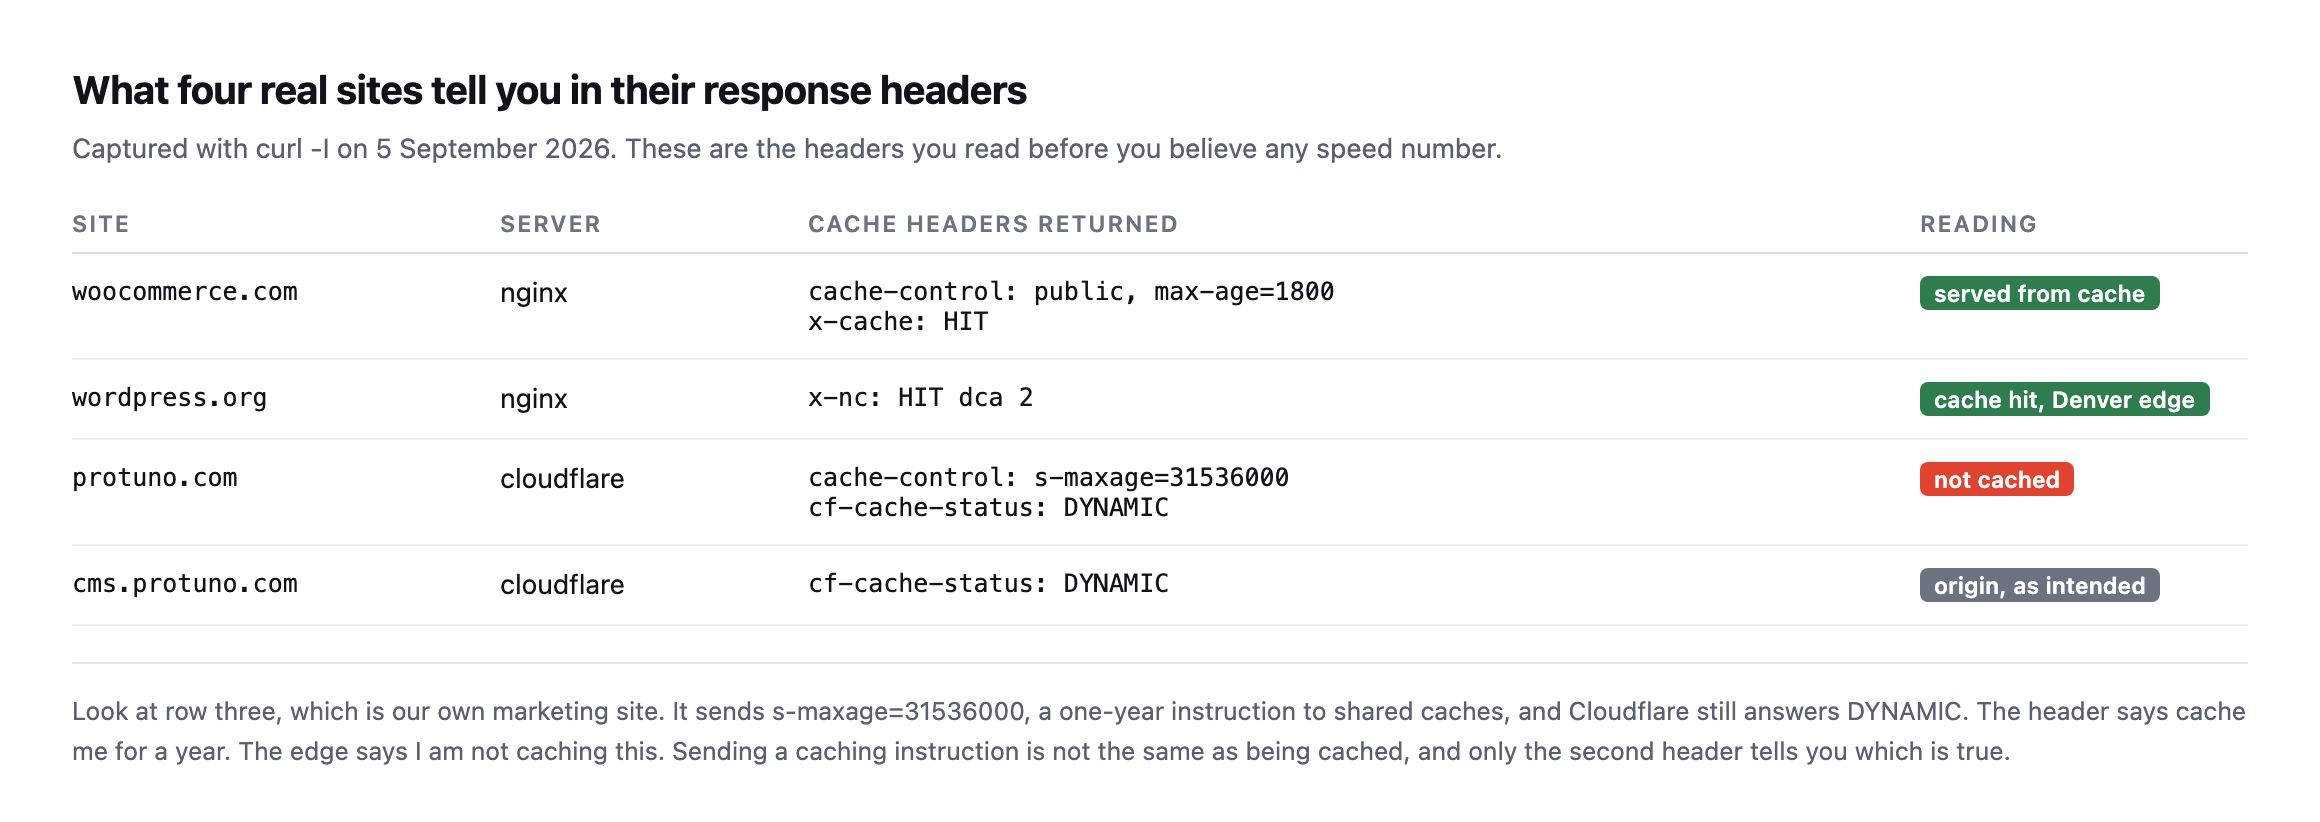
Cloudflare answers DYNAMIC, meaning it is not being cached at the edge at all. I did not go looking for that. It turned up while measuring for this post, which is rather the point of measuring.*
That gap between “what the site asks for” and “what the cache did” is where most performance confusion lives.
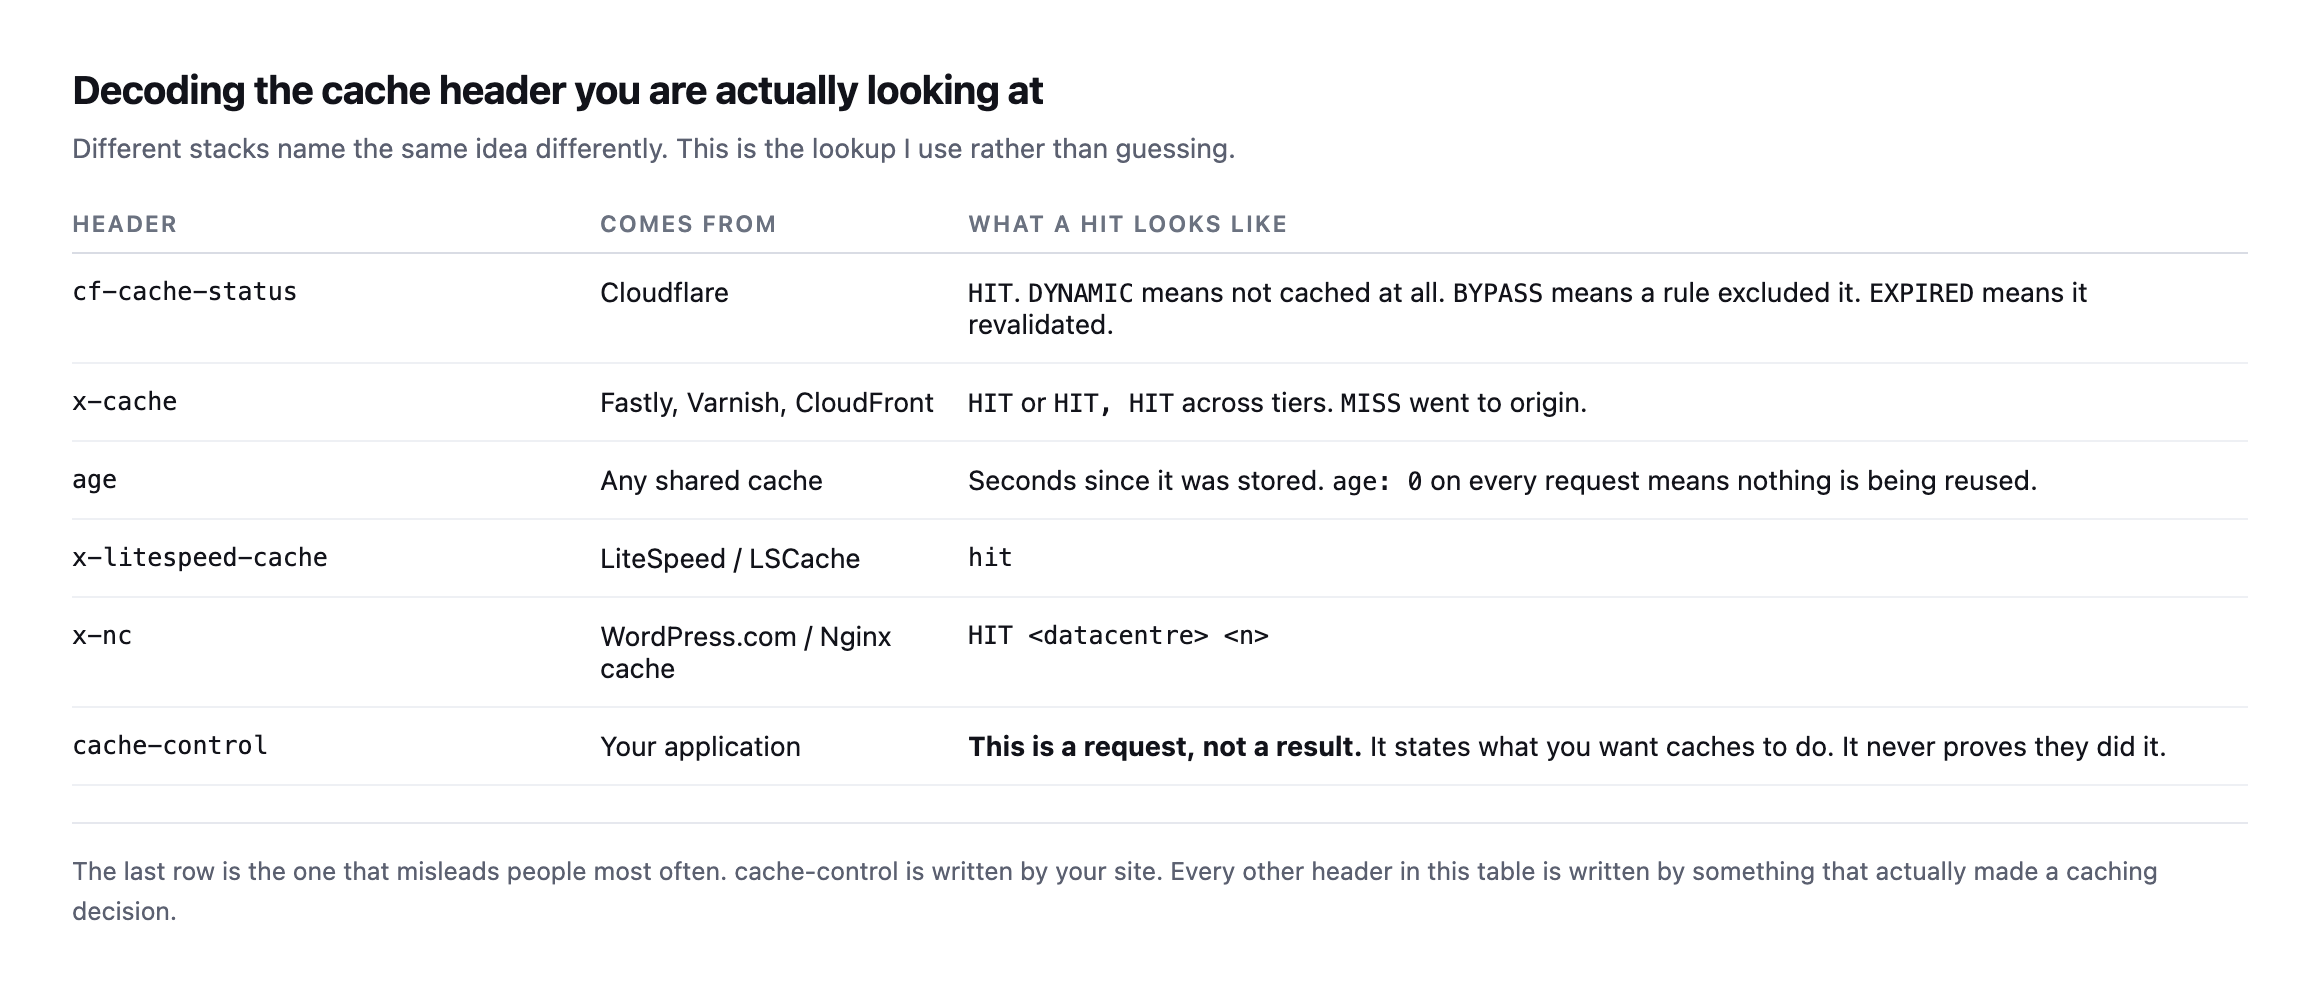
cache-control is written by your ownsite and only states an intention. Every other header here was written by something that actually made a decision.*
| Header | Comes from | What a hit looks like |
|---|---|---|
cf-cache-status | Cloudflare | HIT. DYNAMIC means not cached at all, BYPASS a rule excluded it |
x-cache | Fastly, Varnish, CloudFront | HIT, sometimes HIT, HIT across tiers |
age | any shared cache | seconds since stored; age: 0 on every request means nothing is reused |
x-litespeed-cache | LiteSpeed / LSCache | hit |
x-nc | WordPress.com / Nginx cache | HIT |
cache-control | your own application | a request, not a result; never proves anything happened |
So what do you do with a slow number
Work in this order, because it goes cheapest to most disruptive.
Confirm which number is slow. Cached and bypassed both slow is an origin problem. Only bypassed slow means your cache is working and your origin is weak, which is survivable but fragile.
Check the server think time specifically. If time_starttransfer minus time_appconnect is under about 200ms, your PHP is not the problem and you should stop optimising it.
If connection setup dominates, the fix is geography, not code. A CDN in front, or hosting nearer the audience.
Only then look at WordPress. Slow plugins, an unindexed query, a bloated autoload table, a theme calling an external API on every page load. A plugin that stopped being maintained is a common culprit here, because nobody has profiled it in years.
Most of the WordPress performance advice on the internet starts at step four. On a lot of the sites I look at, the answer was in step three, and somebody spent a weekend on step four.
The part that does not scale
None of this is hard. It is two commands and a subtraction.
The problem is that it is two commands per site, and the answer changes every time hosting changes, a CDN rule is edited, or a plugin starts calling something slow on every request.
You will do it thoroughly during onboarding, and then not again until a client complains. That is the same shape as the unbilled half hour that every other check falls into.
Protuno’s Performance agent, Dash, carries a server response time check that measures origin rather than edge, on a schedule, across a portfolio. Being straight with you as always: Dash is built and named but not live yet. The free audit does run a server response check today, from the domain alone, alongside the caching headers described above.
Until the rest ships, the curl line is genuinely enough. Put it in whatever runbook you keep, next to the check for scheduled jobs that quietly stopped.
And measure your own site first. I did, and it is the slowest one in the chart.
Comments