The WordPress Page Cache Header Lies. Here Is What To Check Instead..
A caching plugin can be active, configured and doing nothing. Two commands separate a cache that runs from one that only looks like it does.

Short answer: do not trust the plugin. Request the page normally, then request it again with a random query string so no cache can serve it, and compare the times. A working page cache shows a gap of several times. If the two are the same, nothing is being cached, whatever the dashboard says.
The wordpress page cache header is worth reading too, but it comes second, and on a lot of WordPress stacks it is not there at all.
The install that taught me to stop trusting settings
I set up a WordPress site this week with a caching plugin on it and went through the usual list. Everything checked out.
Then I looked for evidence the cache had ever stored anything.
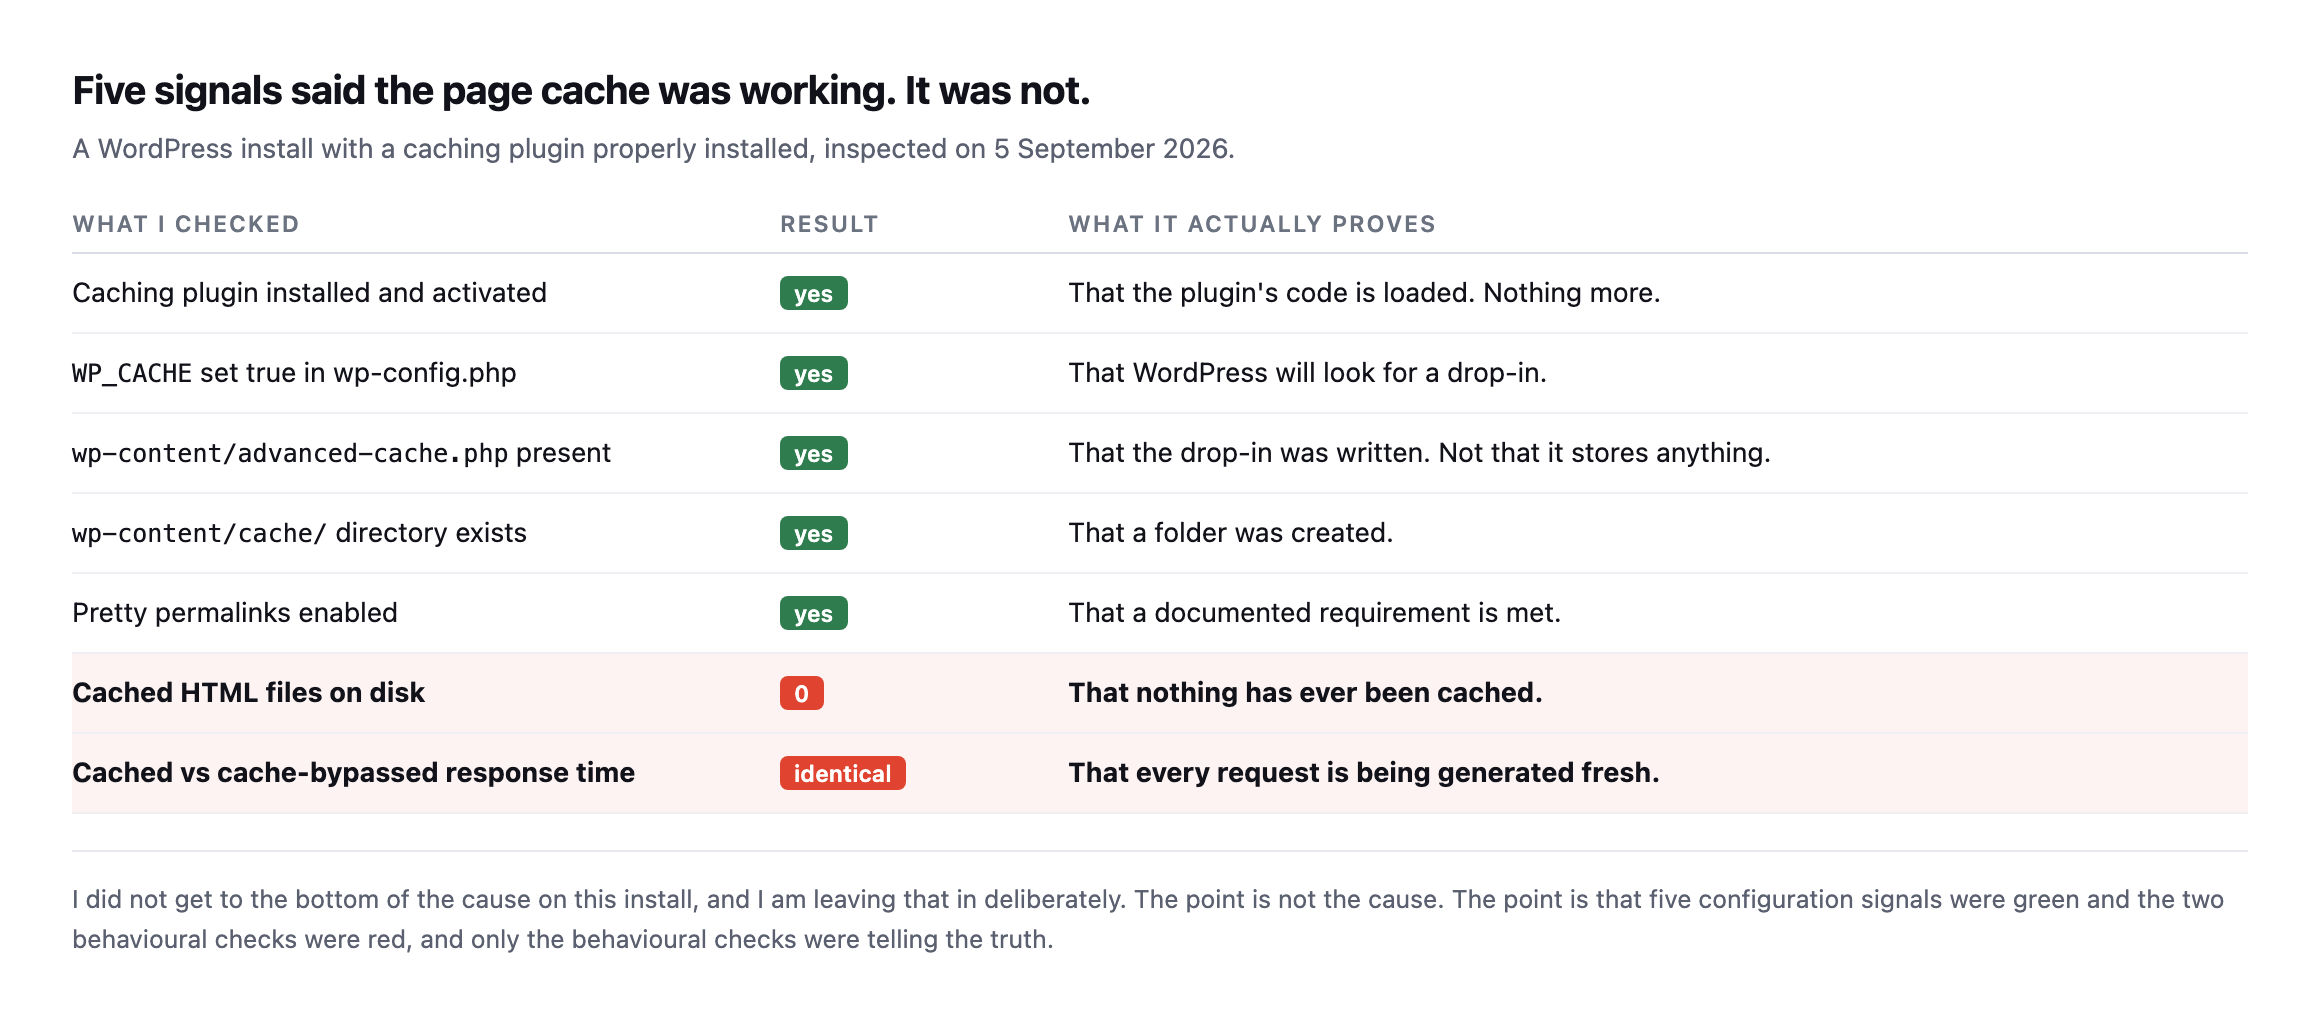
you. The two red ones are what a visitor experiences. I never did work out the cause on this install, and I have left that in on purpose, because the lesson is not the cause.*
Every configuration check passed. The cache had never written a single file.
If I had reported on that site from the admin screens, I would have told a client their caching was fine. It was not fine. It was absent.
The test that cannot be fooled
Two requests. The second one carries a query string nothing has ever requested, so no cache can have a copy.
# as a normal visitor
curl -s -o /dev/null -w '%{time_starttransfer}\n' https://example.com/

# same page, cache bypassed
curl -s -o /dev/null -w '%{time_starttransfer}\n' "https://example.com/?n=$RANDOM"
Run each three times, because one sample is noise.
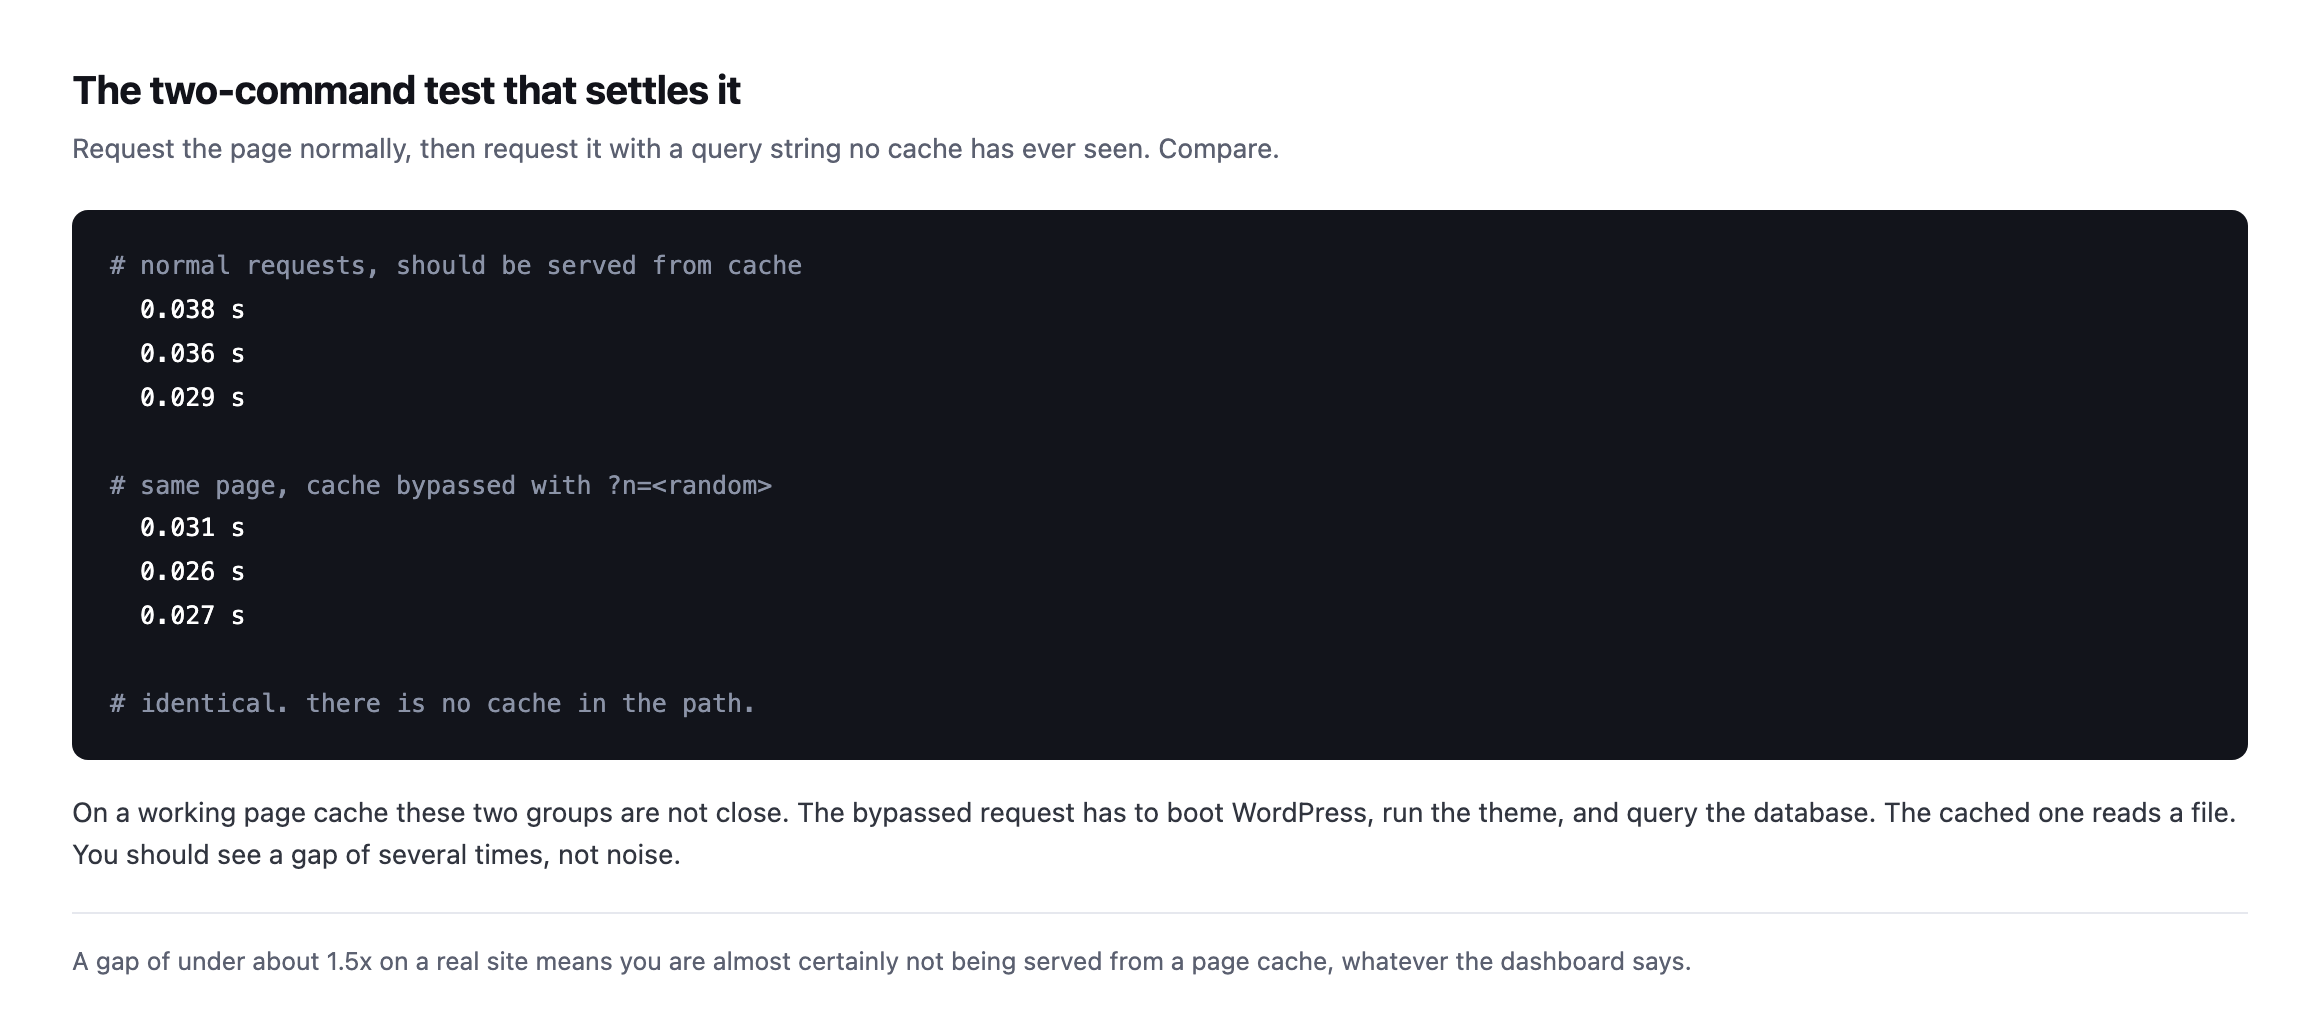
because the bypassed request has to boot WordPress, run the theme and hit the database, while the cached one reads a file off disk.*
What you are looking for is a gap. Several times over, not a few milliseconds.
Under roughly 1.5x on a real site and I stop believing there is a page cache in front of it.
Reading the WordPress page cache header, and knowing its limits
Headers are quicker than timing when they exist. The catch is that plenty of WordPress page caches, especially disk-based plugin caches, emit nothing to identify themselves.
curl -sI https://example.com/ | grep -iE 'x-cache|cf-cache-status|age|x-litespeed-cache'A hit looks like x-cache: HIT, or cf-cache-status: HIT, or an age value above zero.
One header to be careful with: cache-control. Your own site writes that one. It says what you would like caches to do, and proves nothing about what any of them did.
I found a live example of that gap while measuring for the companion piece on TTFB. Our own marketing site sends a one-year s-maxage and Cloudflare still answers DYNAMIC. The instruction is being sent. It is not being followed.
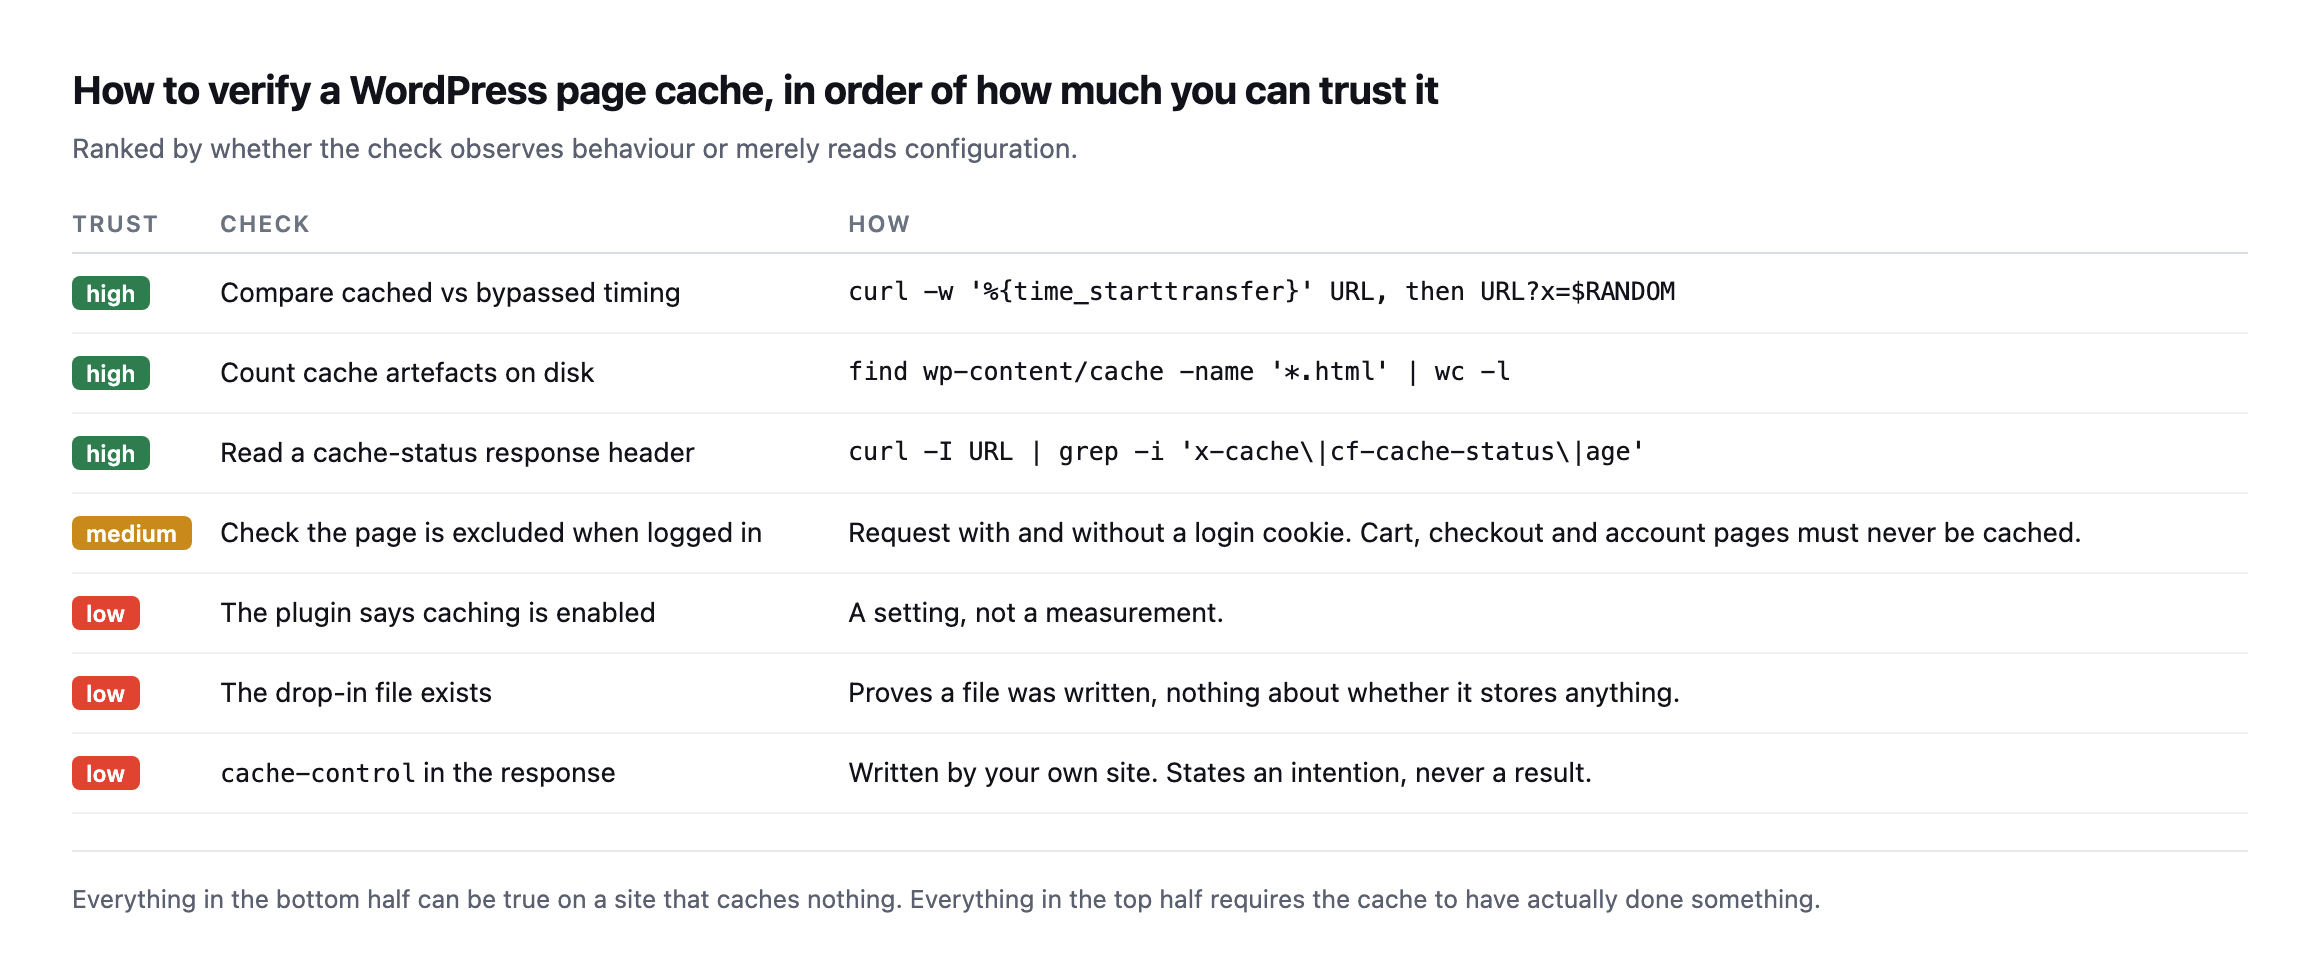
the bottom half can be true on a site that caches nothing at all, which is exactly the site I had in front of me.*
The same ranking as text, so a runbook can link to it instead of an image:
| Trust | Check | How | |||
|---|---|---|---|---|---|
| High | Cached vs bypassed timing | curl -w '%{time_starttransfer}' on the URL, then on URL?x=$RANDOM | |||
| High | Count cache files on disk | `find wp-content/cache -name ‘*.html’ \ | wc -l` | ||
| High | Read a cache-status header | `curl -I URL \ | grep -i ‘x-cache\ | cf-cache-status\ | age’` |
| Medium | Logged-in requests bypass the cache | request with and without a login cookie | |||
| Low | “Caching enabled” in the plugin | a setting, not a measurement | |||
| Low | The drop-in file exists | proves a file was written, nothing about whether it stores anything | |||
| Low | cache-control in the response | written by your own site, states an intention, never a result |
Caveat: the failed-cache install earlier in this post is one site, not a survey. I am not claiming a percentage of WordPress installs silently fail to cache. The claim is narrower and checkable on your own sites today: the five configuration signals everyone trusts can all be green while the two behavioural ones are red, and only the behavioural ones tell you the truth.
What age tells you that HIT does not
cf-cache-status: HIT and its equivalents answer one question: was this response served from cache. They do not tell you how stale that cached copy is, and the two are worth checking together rather than trusting a bare HIT on its own.
I checked one of our own sites live rather than assuming the header tells the whole story:
cache-control: public, max-age=300, stale-while-revalidate=86400
age: 11863
cf-cache-status: HIT
The site’s own Cache-Control header asks for a five-minute lifetime, max-age=300. The age header, which the cache adds to report how long it has held the object, reads 11863 seconds, just under three and a quarter hours. The cache answered HIT, correctly, and it is serving content roughly forty times older than the freshness window the origin asked for.
That is not necessarily broken. stale-while-revalidate=86400 explicitly permits serving stale content for up to a day while a fresh copy is fetched in the background, and a busy cache can reasonably fall behind on revalidation under load. But it is exactly the gap this whole post keeps returning to: a passing signal, HIT, sitting on top of a number that tells a completely different story once you read it. HIT says the mechanism worked. age says what it actually served, and only one of those two is the number worth checking before you tell a client their homepage reflects the change they just published.
The practical version: whenever you check cf-cache-status or x-cache, read age in the same breath. A HIT with age: 4 is fresh. A HIT with age in the thousands, on a page that changes often, is a cache doing its job technically while quietly showing visitors something old.
The cache-busting header that actually works, and the older one that does not
There is a piece of received wisdom worth testing rather than simply repeating to a client: that sending Pragma: no-cache or Cache-Control: no-cache as a request header forces a fresh copy from the origin. Only one of those two did anything at all, tested against the same stale cache found in the section above.
| Request header sent | Result |
|---|---|
| none (normal request) | cf-cache-status: HIT, age: 11918 |
Cache-Control: no-cache | cf-cache-status: DYNAMIC, origin hit fresh |
Pragma: no-cache | cf-cache-status: HIT, age: 11920, no effect |
Pragma: no-cache is an HTTP/1.0-era header, kept alive mostly by old advice and some legacy tooling, and this CDN simply ignores it. Cache-Control: no-cache is the modern, correctly specified way to ask a cache to revalidate, and it worked exactly as intended: the response came back marked DYNAMIC, meaning the request reached the origin rather than being served from the stale cached copy.
This matters beyond curiosity. It is also what a browser’s hard refresh sends, and it is why a developer hitting Ctrl-Shift-R sees the fresh page while a client hitting an ordinary refresh, or worse, describing the problem over the phone without refreshing at all, keeps seeing the old one. If you are debugging a “the change isn’t showing” ticket, test both headers before concluding the cache itself is broken. One of them proves the cache can be bypassed correctly, which narrows the actual problem down to why it is not happening for an ordinary visitor.
It is also worth explaining this distinction to a client the next time “just refresh the page” does not fix what they are describing. Most people’s mental model of a stale page is that their own browser has an old copy, so they refresh, and a normal refresh does nothing to a shared cache sitting between them and the origin. Telling them to hard-refresh, or giving them the two header names above to pass to whoever is debugging it, saves a round of “I already tried refreshing” that goes nowhere because the two kinds of refresh are solving different problems.
The same test is worth running as part of onboarding any new client site, alongside the behavioural checks earlier in this post. Confirming that a cache-busting request actually reaches the origin, rather than assuming it does because it did on the last site, is a five second addition to a check you were already running, and it is the difference between telling a client “try a hard refresh” with confidence, backed by a header you actually checked, and repeating advice you picked up somewhere and never tested against the site actually sitting in front of you today, which is the entire difference this post has been arguing for, quietly, from the very first paragraph onward.
Caveat: one CDN, one site, one test. Different caches honour different subsets of the cache-control request directives, and I would verify this on the specific stack you are debugging rather than assume every provider treats
Pragmaidentically. What generalises is the method: send both, compare the cache-status header, and let the response tell you which one your specific cache actually listens to.
The one that costs real money
There is a second failure that runs the other way, and it is worse.
A cache that is working, on a page that should never be cached.
Cart, checkout and account pages have to be excluded, or one customer sees another customer’s basket. Most cache plugins exclude WooCommerce pages by default, and most of the time that default survives.
It does not always survive a hosting migration, a new CDN rule, or somebody adding a page-rule that was meant to fix something else.
Test it by requesting a cart URL with and without a login cookie, and confirming you never get a cached response on either.
Why this ends up on the never-done list
The check takes a minute. It needs redoing after every hosting change, every CDN change and every cache plugin update, on every site you look after.
So it gets done once and then trusted forever, which is the same trap as the scheduled jobs nobody notices have stopped and the backup file left in the web root.
Protuno’s free audit reads the caching headers from the domain today, so you can see at a glance which sites in a portfolio are announcing a cache and which are not. Being straight about the rest: Dash, the Performance agent that would re-run the timing comparison on a schedule, is built and named but not live yet.
The two curl lines above are the whole method in the meantime. Run them on the client site you are most confident about. That is the one worth checking.
The header rules that most often get this wrong
Covers Cache-Control, Vary and the specific ways a CDN cache miss happens even when a header is present, the mechanism underneath the pass/fail check this post walks through.
Comments