WordPress Agency Automation: Detection Is Solved, Deciding Is Not.
I classified 55 operational checks. All 55 detect automatically. Eight are safe to fix unattended. That gap is the whole shape of the job.

Short answer: every operational check an agency runs on a WordPress site can be automated. Almost none of the fixes can. I went through 55 checks one at a time and found eight I would let run unattended on a client site. The other 47 need a person, and that is not a temporary state of the tooling.
This is the last operational post in a thirty day run, and it is the one I could only write after doing the other 57.
The number that surprised me
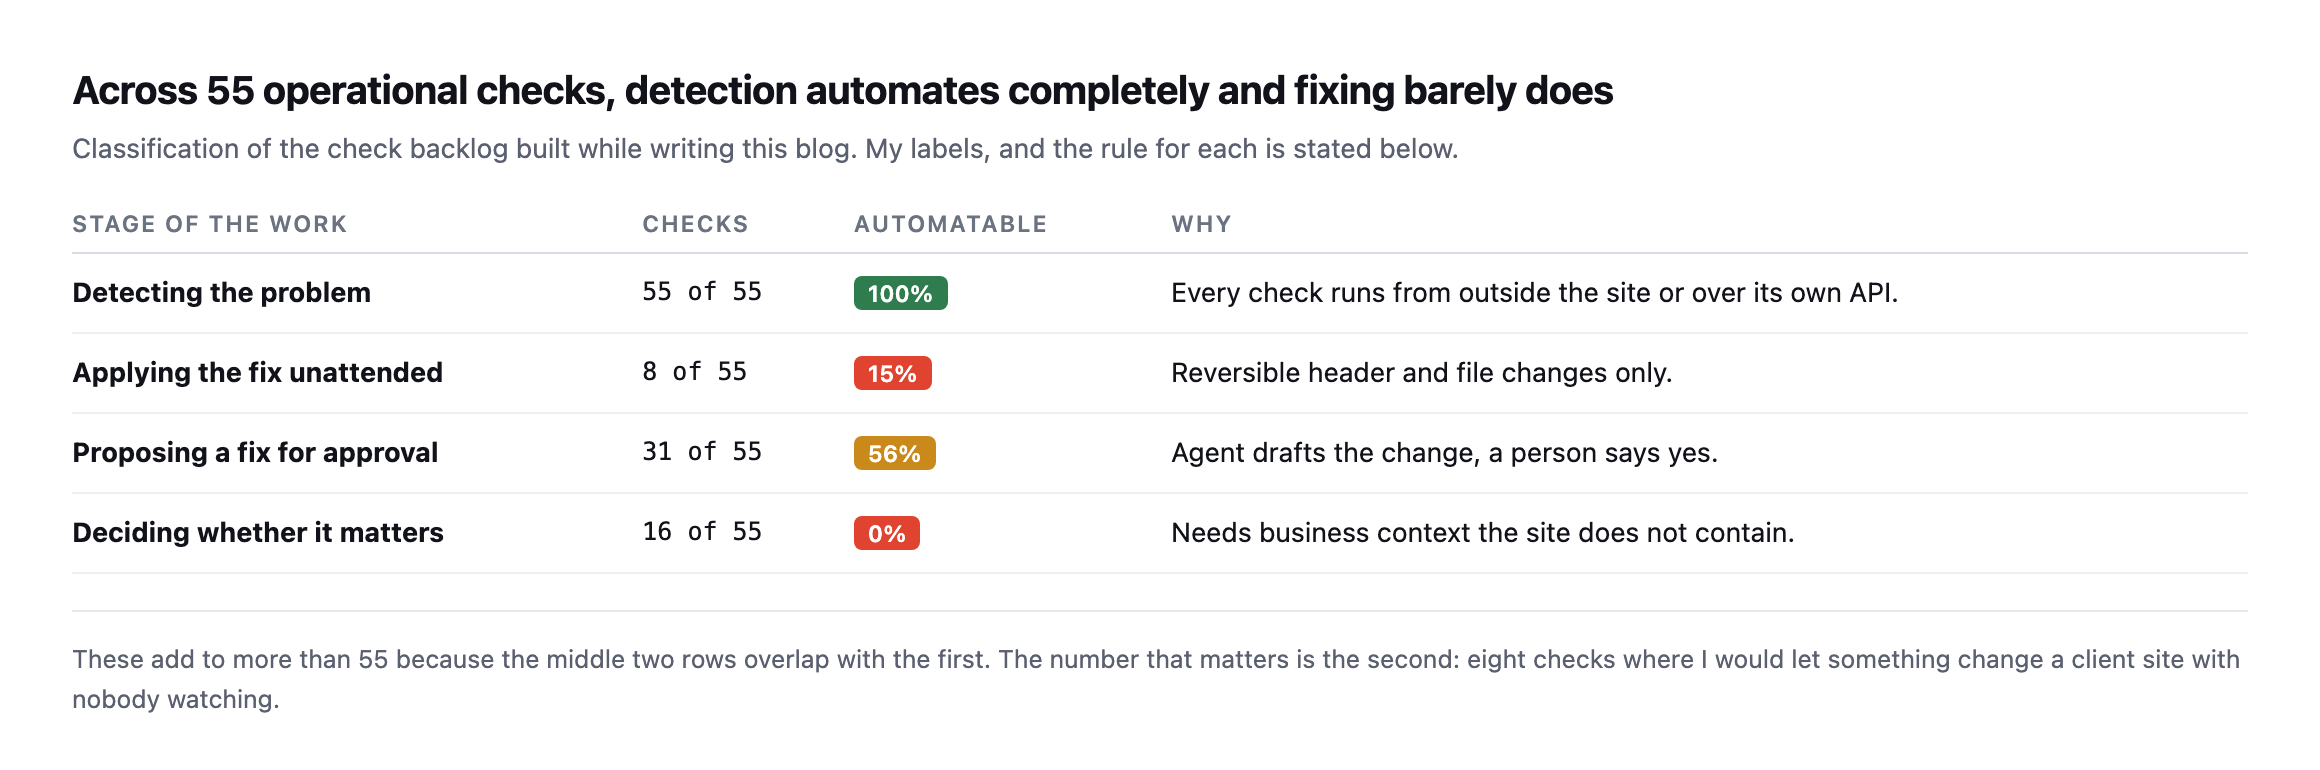
I built a backlog of 55 checks while writing this blog, one post per check, each written after actually running it. Then I classified them by how far automation gets.
specific calls.*
| Stage | Checks | Automatable | Why |
|---|---|---|---|
| detecting the problem | 55 of 55 | 100% | every check runs from outside the site or over its own API |
| applying the fix unattended | 8 of 55 | 15% | reversible header and file changes only |
| proposing a fix for approval | 31 of 55 | 56% | agent drafts the change, a person says yes |
| deciding whether it matters | 16 of 55 | 0% | needs business context the site does not contain |
I expected the fix number to be low. I did not expect it to be eight.
And the detection number matters just as much in the other direction. If every check runs automatically, then the excuse that made agency operations tolerable for twenty years is gone. Nobody gets to say a problem went unnoticed because checking forty sites by hand was impractical. It is not impractical any more. It takes seconds.
The eight
| Check | What it changes | How the agent undoes it |
|---|---|---|
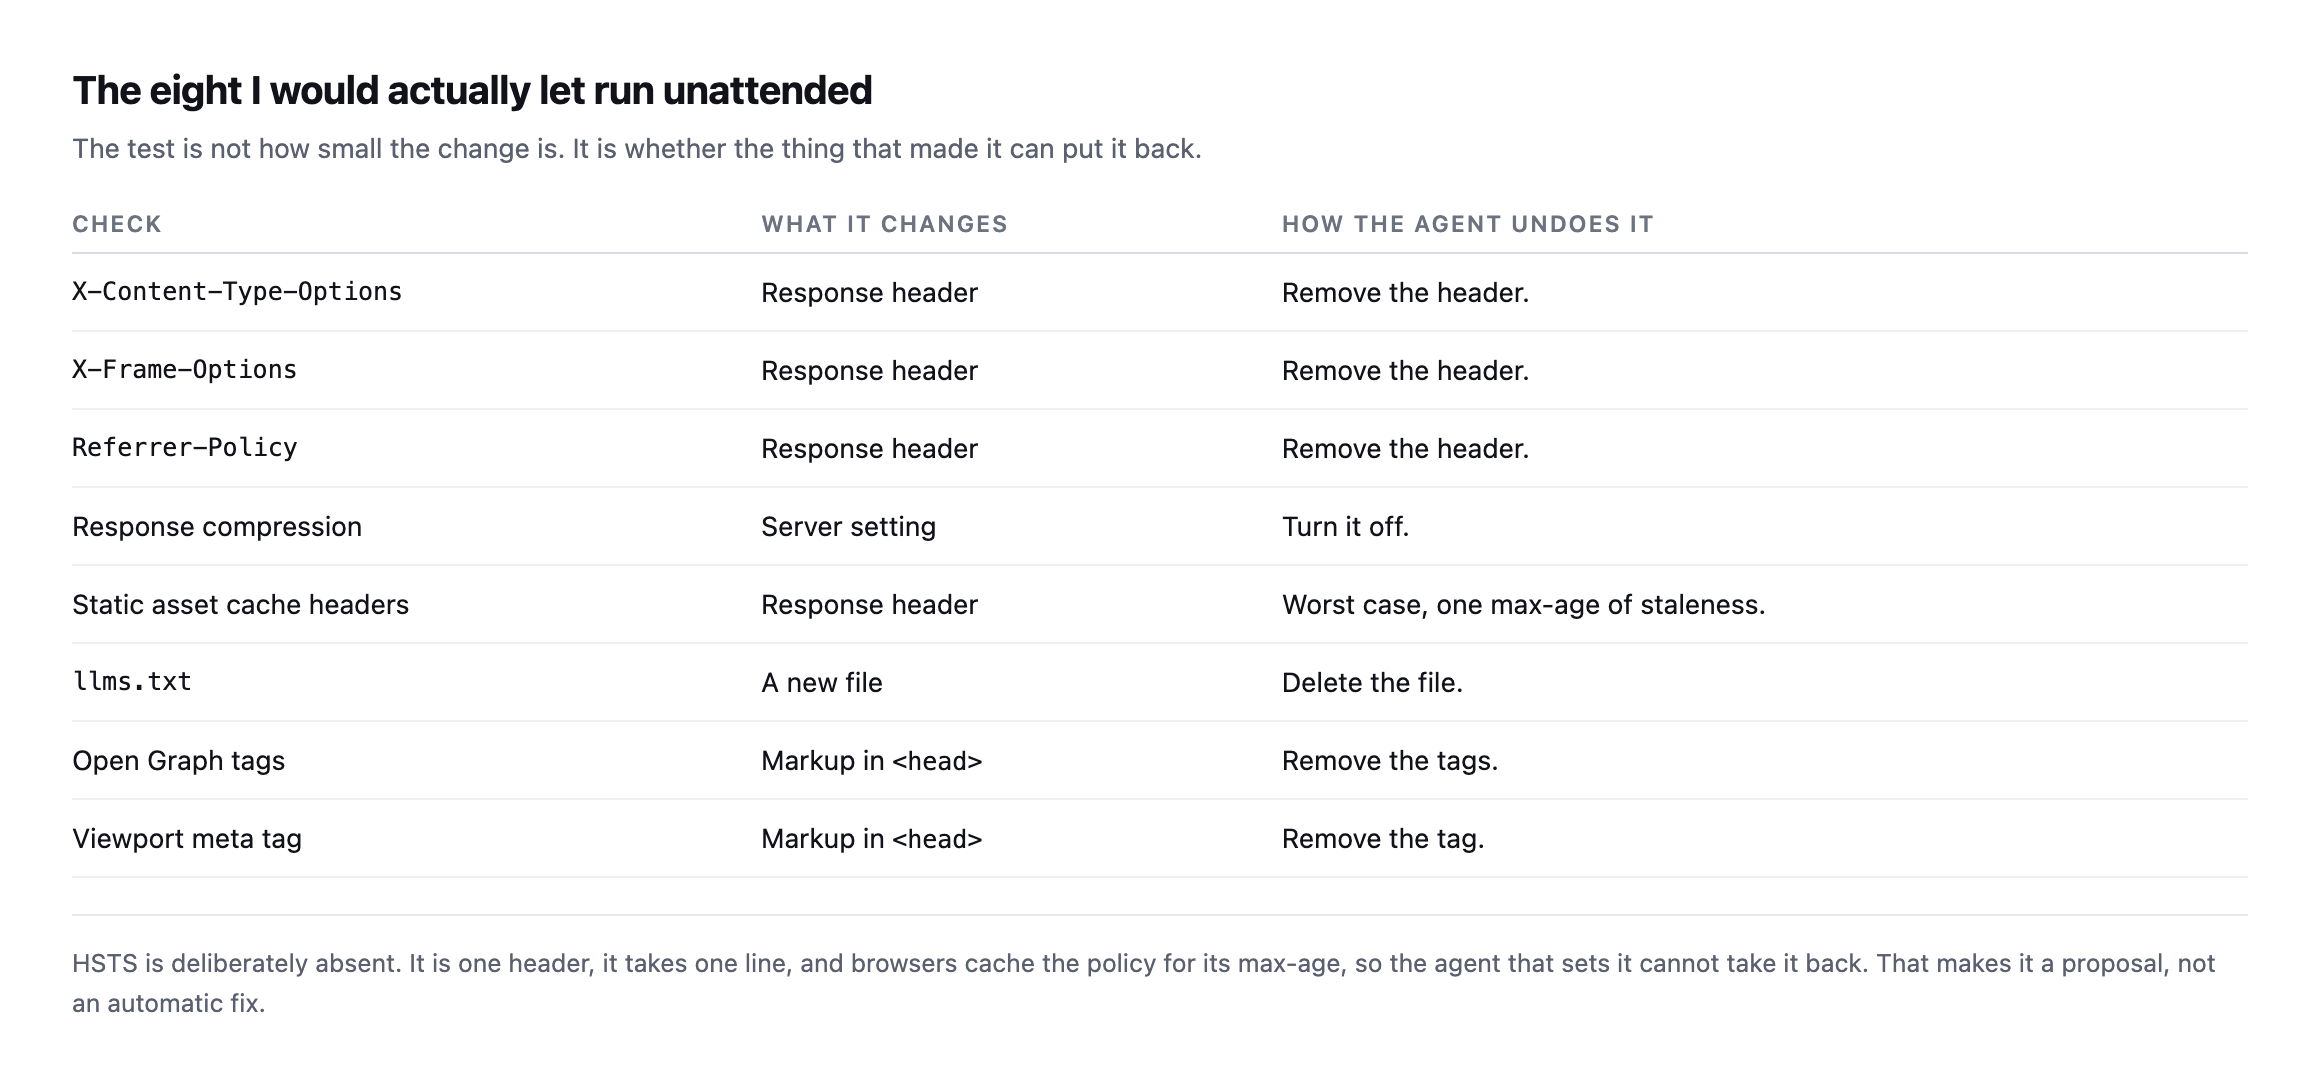
X-Content-Type-Options | response header | remove the header |
X-Frame-Options | response header | remove the header |
Referrer-Policy | response header | remove the header |
| response compression | server setting | turn it off |
| static asset cache headers | response header | worst case, one max-age of staleness |
llms.txt | a new file | delete the file |
| Open Graph tags | markup in | remove the tags |
| viewport meta tag | markup in | remove the tag |
The test is not how small a change is. It is whether the thing that made it can put it back.
HSTS fails that test in a way that is easy to miss. It is one header, one line, universally recommended, and once a browser has seen it the policy is cached for the whole max-age. The agent that set it cannot unset it in anybody’s browser. That is not a reason never to add HSTS. It is a reason a person should decide, once, per site.
Everything on that list, by contrast, is undone by deleting what was added. Bad decision, one request, back to where you were.
Two of the eight will look too trivial to bother automating, and that is the wrong way to read them. A viewport meta tag and an llms.txt file are each five minutes of work. The value is not the five minutes, it is that they get done on all forty sites rather than on the four you happened to open this month. Automation’s return on small items comes from coverage, not from the time per item.
The reverse also holds, and it is worth saying because it cuts against the usual pitch. The biggest wins on any given site are almost always in the 47, where a person has to decide. Automation does not get you the big wins faster. It gets you the small wins everywhere, and it tells you where the big ones are.
What actually changes about the job
| Part of the job | Before | After |
|---|---|---|
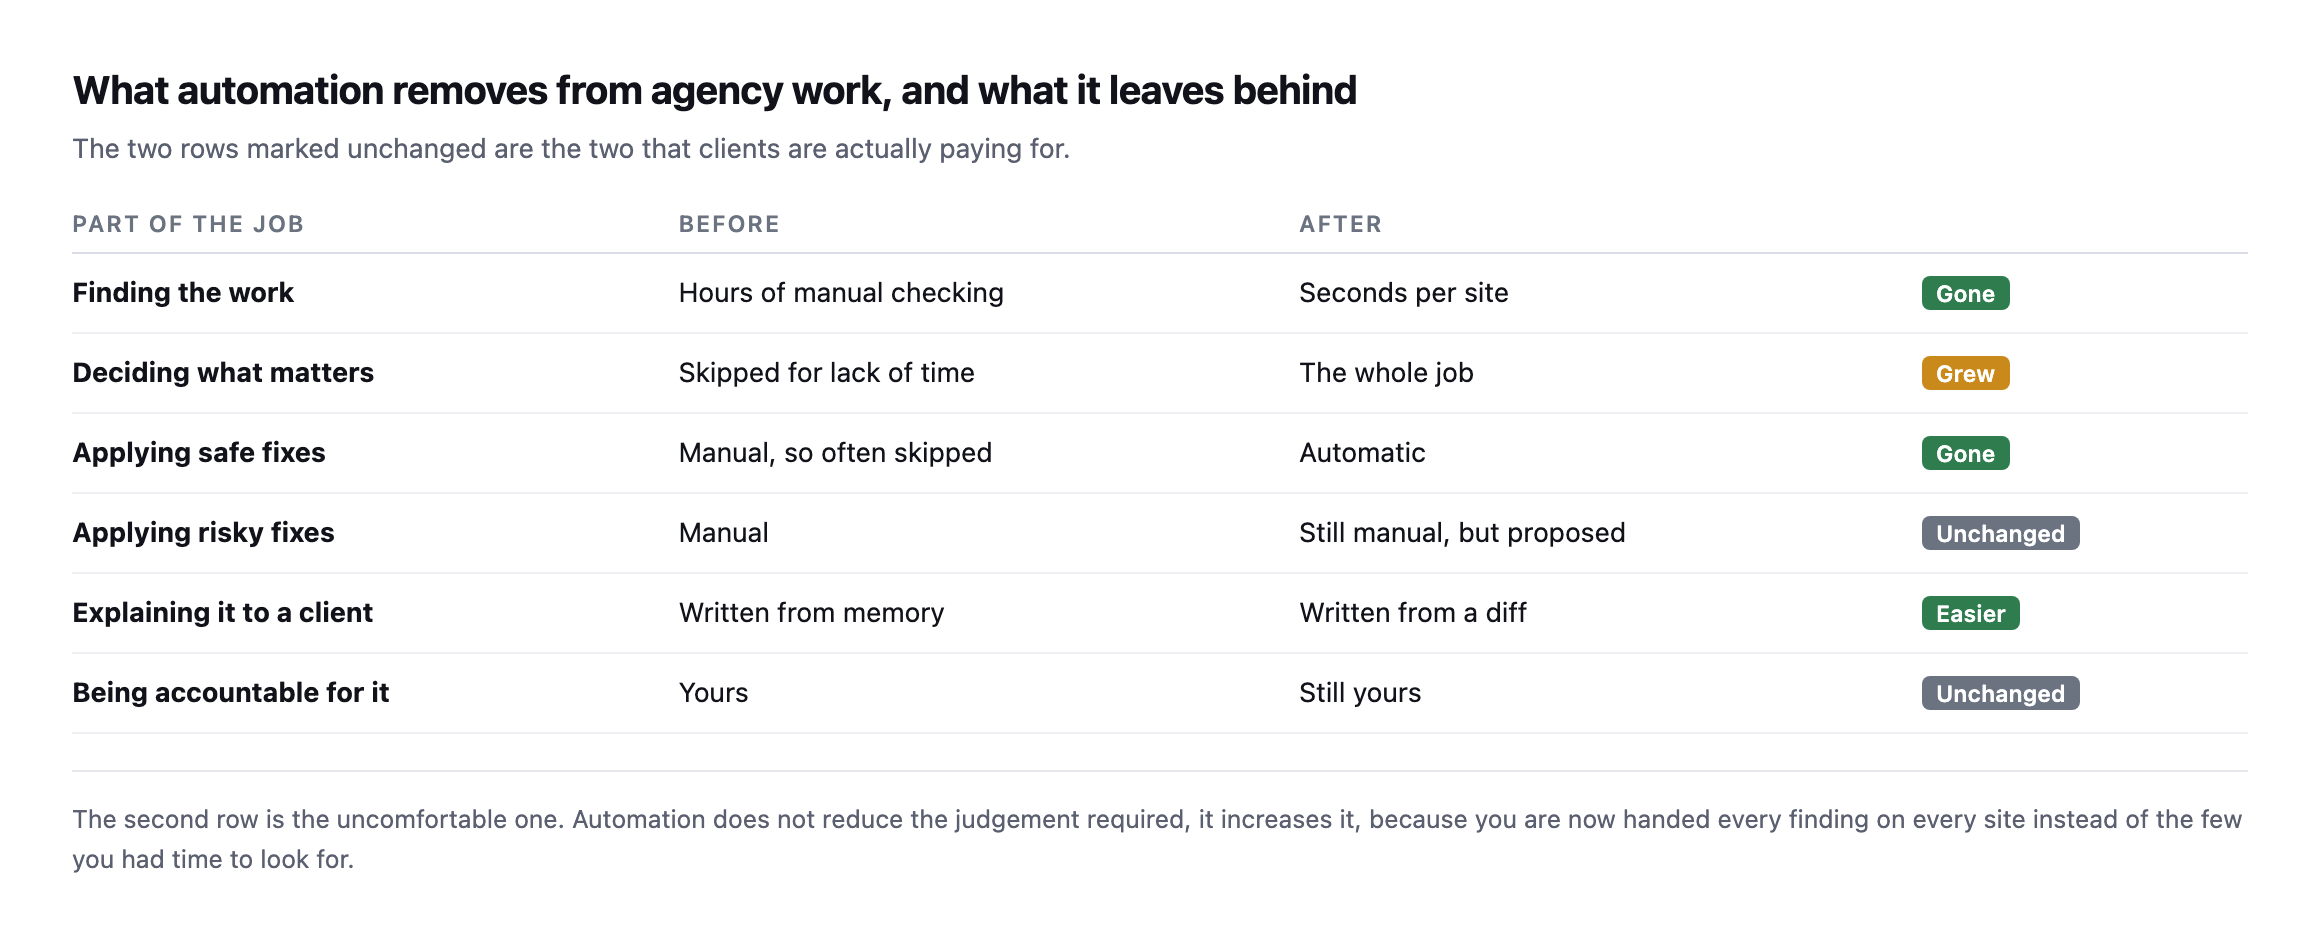
| finding the work | hours of manual checking | seconds per site (gone) |
| deciding what matters | skipped for lack of time | the whole job (grew) |
| applying safe fixes | manual, often skipped | automatic (gone) |
| applying risky fixes | manual | still manual, but proposed (unchanged) |
| explaining it to a client | written from memory | written from a diff (easier) |
| being accountable for it | yours | still yours (unchanged) |
The second row is the uncomfortable one and I want to be direct about it. Automation does not reduce the judgement required. It increases it. You used to see the handful of findings you had time to look for. Now you get all of them, on every site, every day.
I lived this while writing the client reporting post: six sites, 30 findings, and the real work was deciding that 23 of them were not worth anyone’s attention. That triage is not a step before the job. It is the job.
The part nobody puts in the pitch
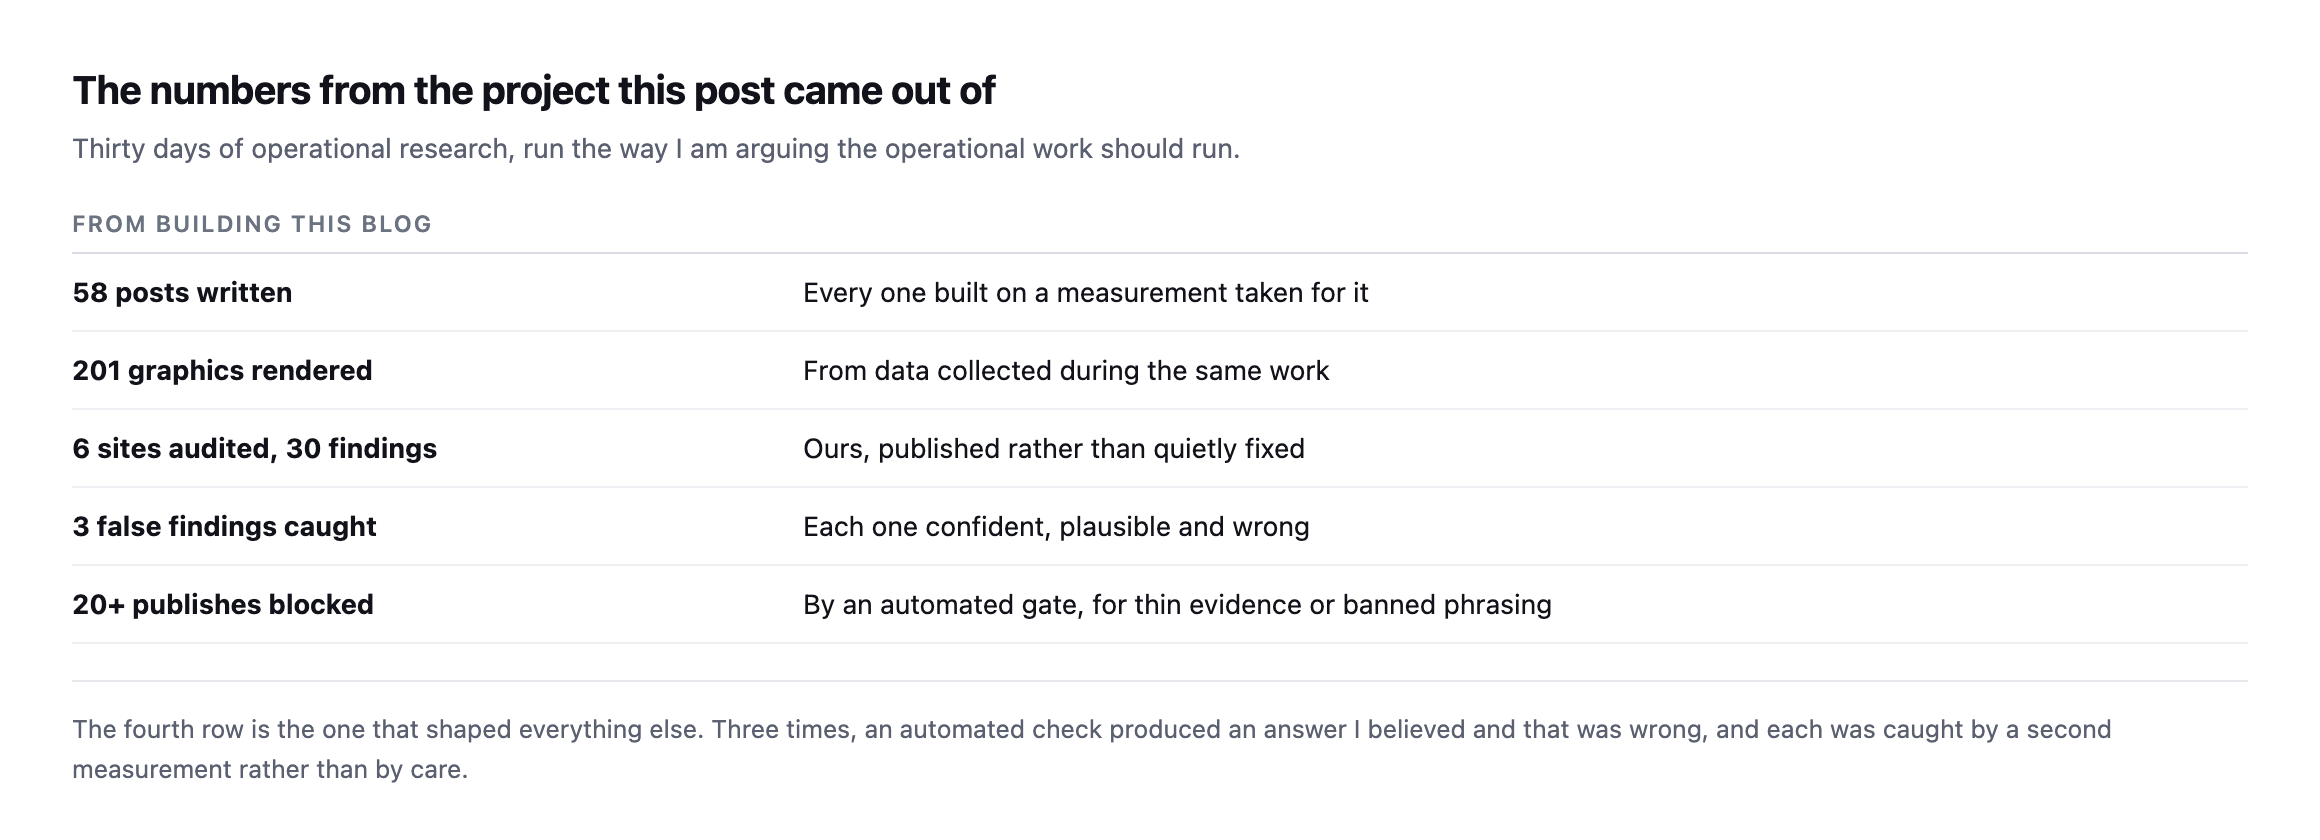
Three times in thirty days, an automated check handed me an answer I believed and that was wrong. A page reported zero images because a compressed response was decoded with the wrong algorithm. A caching plugin appeared broken because I had deleted a directory myself. A cart appeared to leak between visitors because a product name matched in a grid block.
None of those were subtle. All three were caught by asking a second question, not by being careful. I wrote up what that means for automating performance work separately, and the conclusion generalises: the automation belongs around the measurement before it belongs around the change.
An agency running unattended fixes on client sites without a second source for every trigger is going to break something and not know why. That is a straightforward prediction and I would like to be wrong about it.
The failure mode will not look like a tool malfunctioning, either. It will look like a site that is fine, a dashboard that is green, and a client who mentions in passing six weeks later that something stopped working. By then the change that caused it is 400 entries down a log nobody reads.
The same project, a second wave later, with the same shape holding
This post was written at 58 posts. The project since grew to a full 60, and a separate pass went back through most of the backlog expanding each one to real depth, re-running every measurement rather than trusting the original reading. That second wave is itself more evidence for this post’s central claim than the original numbers were, because it was, in effect, the same detection-versus-decision split applied recursively to the blog’s own back catalogue.
Re-checking found real drift on both sides of the ledger. Some findings had been quietly fixed: a CAA record completed, a site’s REST user enumeration closed, an image library fully converted to modern formats. Others were confirmed still open, unchanged since first published: a domain still missing DKIM, a debug log still exposed, a DMARC policy still capped at five percent enforcement months after that cap was first flagged. And a handful of genuinely new false findings turned up in the process of re-measuring, not from the original checks but from the re-checking itself: a brotli response decoded as gzip a second time, a Store API request that silently returned homepage HTML instead of JSON because of plain permalinks, a WooCommerce install whose block-based checkout broke an HTML-scraping assertion that had worked perfectly on a different, classic-checkout install.
None of that changes the eight-of-fifty-five ratio this post opened with. If anything it sharpens the argument, because the second wave was pure detection work, re-running checks, comparing results, writing down what changed, and every single piece of judgement in it, which finding still mattered, which correction was worth publishing, which drift was meaningful versus noise, still required a person reading the result and deciding. Automating the second pass at checking would have been exactly as straightforward as automating the first one. Automating the decisions built on top of it would not have been, for the same reasons this post already gives.
What WordPress agency automation should mean in practice
Automate every check. There is no reason left not to, and the checks are the cheap part.
Then spend the time you get back on the two rows that did not change. Decide what matters, and be accountable for it. Those are not consolation prizes left over after the machines took the good work. They are the work, and they were always the work, obscured for two decades by the tedium of finding things out.
Protuno is built on this split: 111 playbooks across six agents, permissioned per check and per site, with the unattended tier kept deliberately small. Everything in this post is why. Straight with you as on every post here: the agents are built and named, and not live yet.
If you run an agency, do this one thing this week: pick your ten busiest sites, run one check across all ten, and look at the shape of the result. Ten hits means you have a standard to set. One hit means you have a site to fix. Neither answer was available to you before, and both are more useful than anything the check itself found.
Why the re-check wave belongs in this table, not outside it
It would be tempting to file the second wave of work under something other than the four stages this post opened with, since re-verifying a past finding feels different from discovering a new one. It is not different, and treating it as a separate category is exactly the mistake this post is arguing against. Re-checking is detection, run again, on a schedule, against the same site. It belongs in the top row of the original table, not in a footnote, because a check that only ever runs once is not a check an agency can stand behind for more than the month it was run in.
The eight-of-fifty-five automatable-fix number would not move even if every one of these re-checks were fully automated tomorrow, scheduled, scripted, running silently in the background across the whole backlog every week. What moved during the second wave, every single time, was the judgement layered on top of a fresh reading: is this drift worth a correction, is this still-open finding worth escalating again, is this newly-discovered measurement bug worth its own paragraph or a quiet fix. That layer is where thirty days of work actually went, and it is the same layer this post already named as the 47 checks that do not automate, applied a second time to the same project rather than assumed to be a one-off cost paid only during the original research.
The practical takeaway for anyone running a similar backlog: budget the re-check as real, recurring work from the start, not as a cleanup pass done once when something looks stale. A finding published once and never verified again is a finding that quietly stops being true at some unknown point after publication, and the only way to know when is to have looked.
Comments